

I have just enrolled in a Data Science course on Udemy and I learned good stuff.
Now is the time to solve the problem of who is winning the bonus.
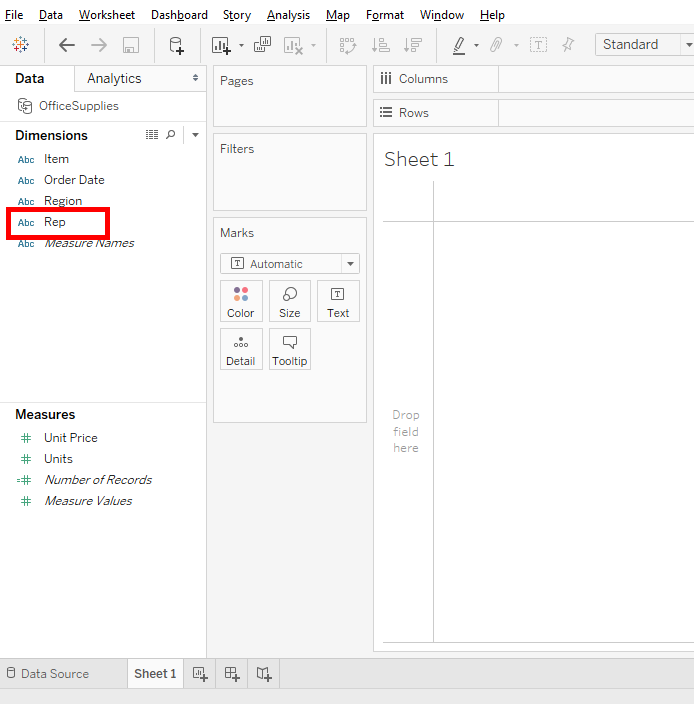
The first thing to do is clean the dashboard. To do this, click on the « Clear Sheet » button.

To start we need to create a « Bar Chart » to see the salesperson. In this data, salesperson named « Rep » for representatives.
To see how many items were sold by each sales representative, you need to put « Rep » in « Columns » and « Units » in « Rows ».
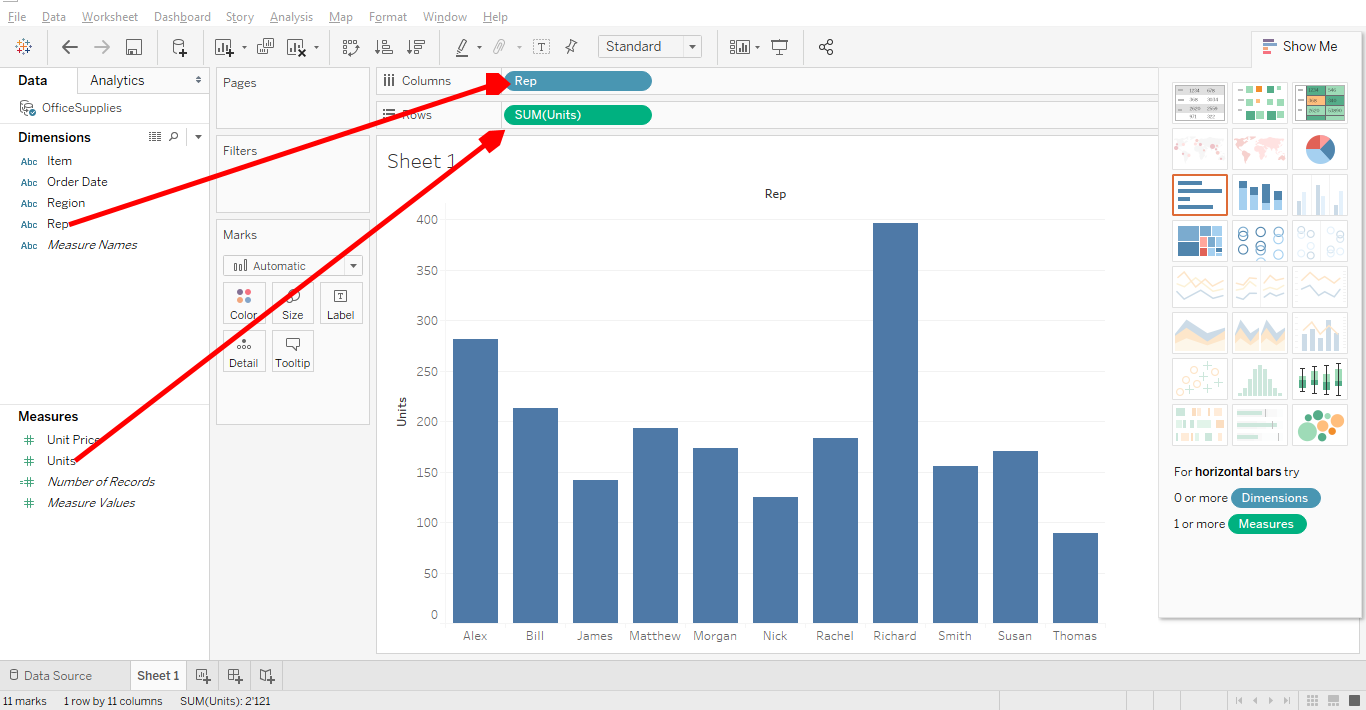
You can see that the representative who sold the most is Richard.
But we want to have more details. We need to know who is the best representative by region and for now, we can’t see that.
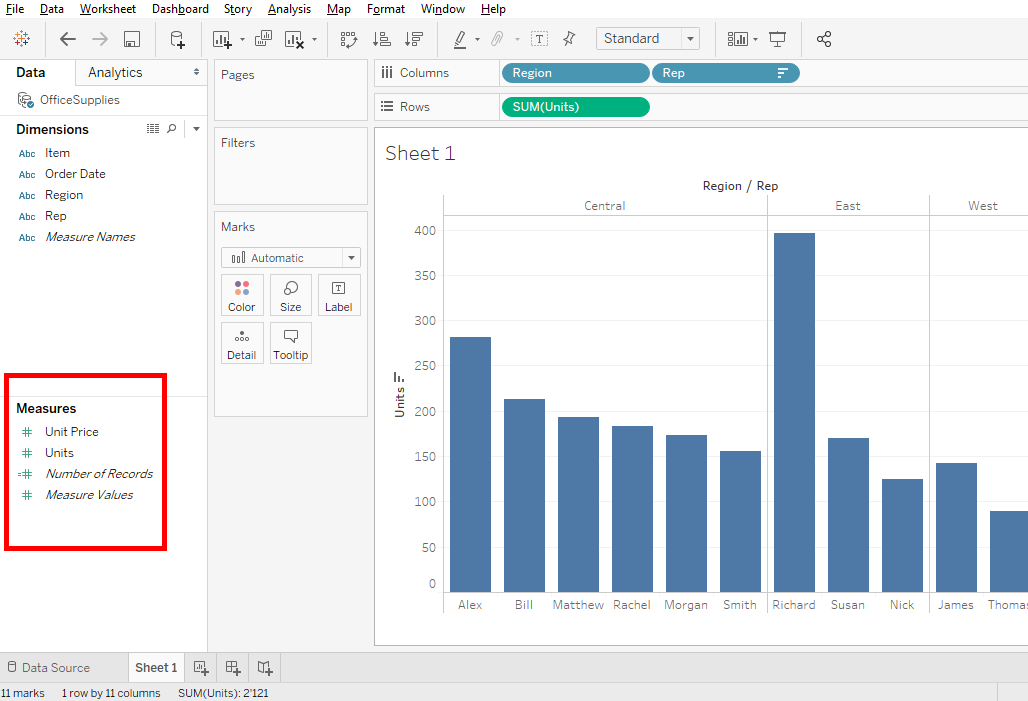
To see this, you put « Region » in « Columns » before « Rep ».
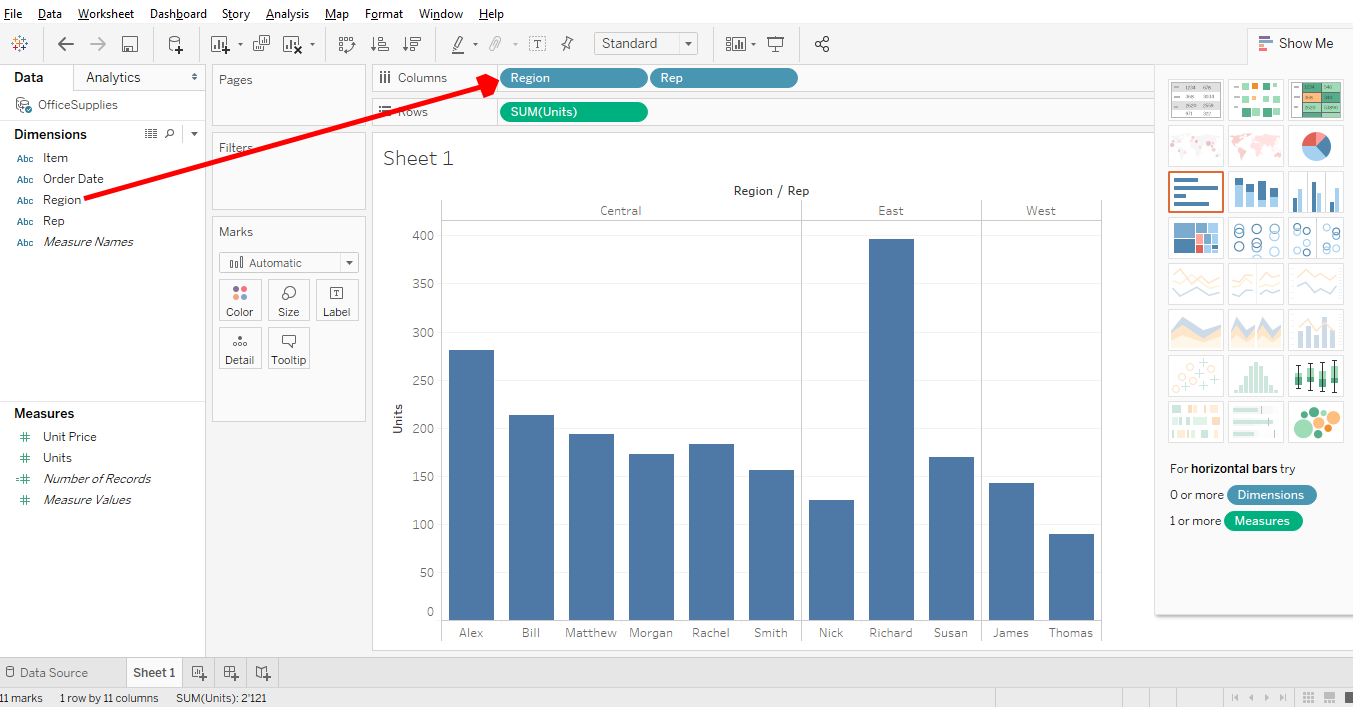
As you can see, the « Bar Chart » changed. There are separations by region.
In each region, you can see the representatives and the number of items they sold. Alex is the best in Central. Richard is the best in the East and James is the best in West.
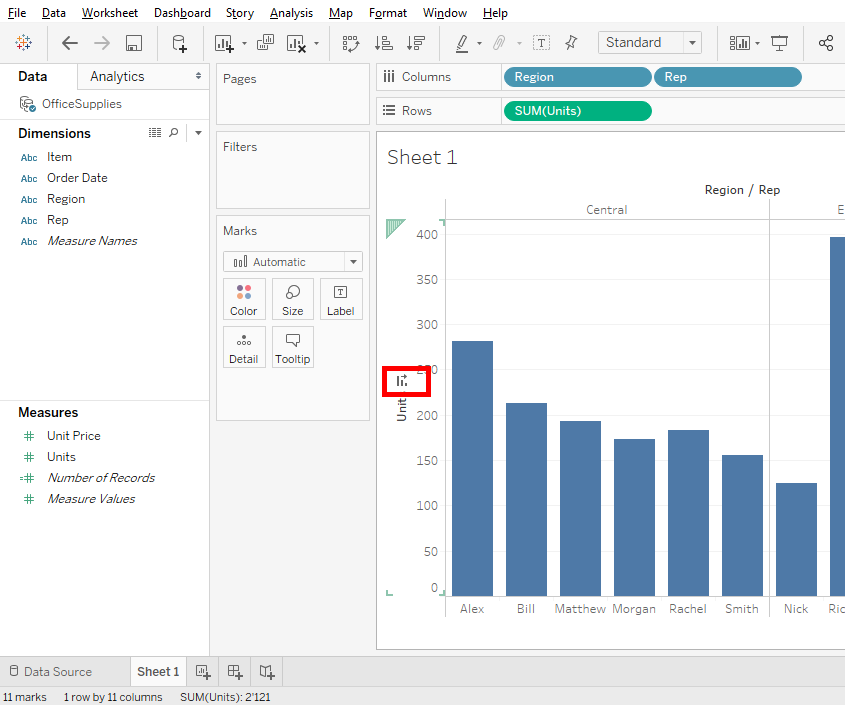
To get better visibility, you can order the bars in descending order. Move the mouse over the label « Units » of the bar chart and an icon will apprear. Click on it and the bars will be sorted in descending order.
Unfortunately, we didn’t answer the question because « Units » is only the number of items sold. What interests us is the amount of money earned by selling the product but we don’t have this type of measure. There is no measure that shows us the total value of sales. There are only « Units » and « Units Price ».
In this case, you have to make a calculation to have the total sales in cash. For each representative, you need to multiply « Units » with « Units Price ».
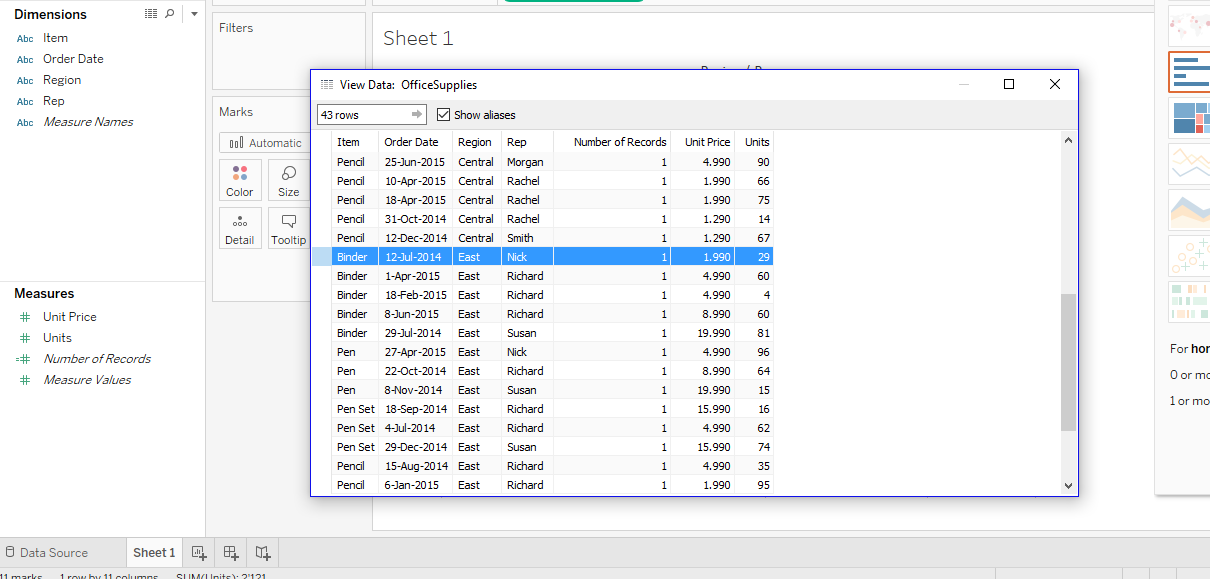
Let’s look at the data to make a test calculation. Right-click on the « OfficeSupplies » data and click on « View Data ». For example, you see that Nick sold 29 binders to $1.99. So 29 (Units) multiplied by 1.99 (Unit Price) equals $57.71 for this sale.

In our data, we have no measure where « Units » is multiplied by « Units Price ».
To solve this problem, you will create an additional measure with a « Calculated Field ». « Calculated Field » si an element that allows us to create measures by calculating quantities.
To create this, right-click in the « Measure » zone and select « Create calculated field… ».

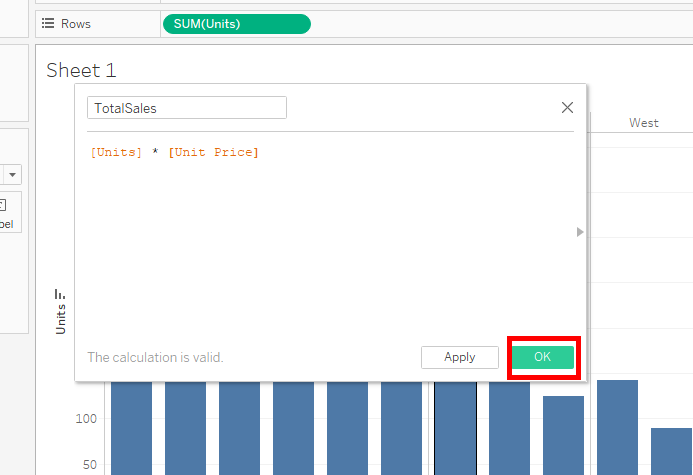
You can name the calcultated field « TotalSales »
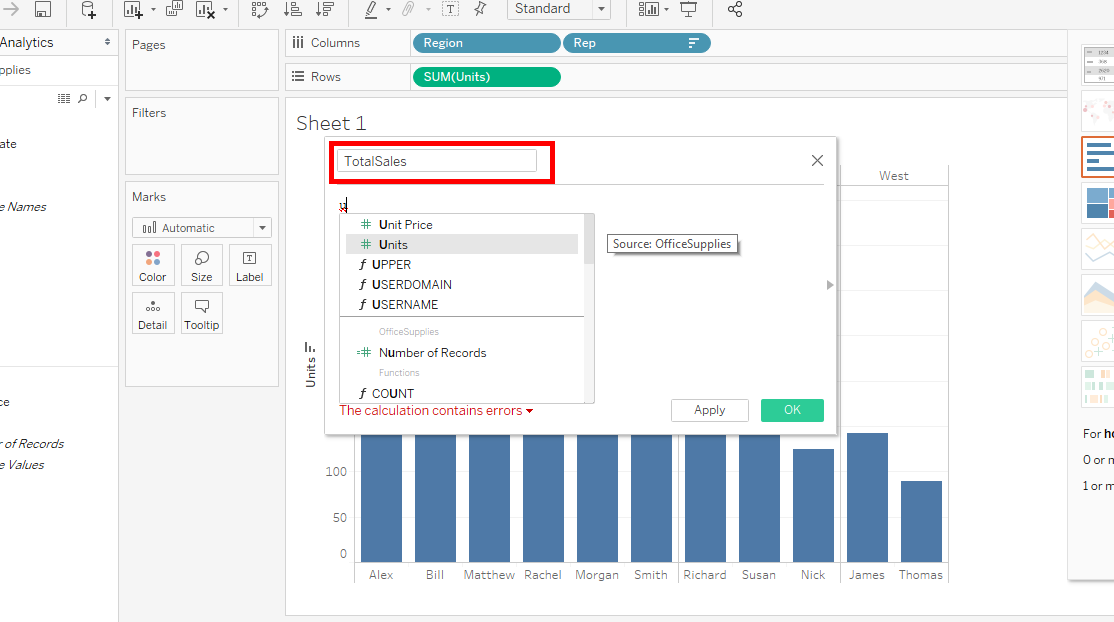
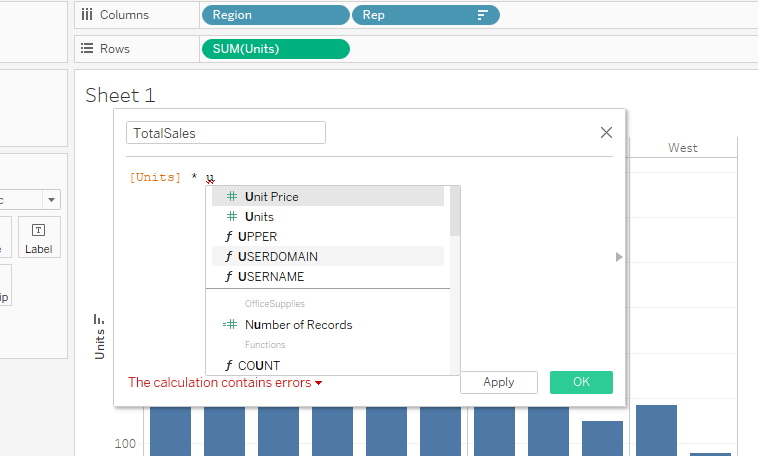
Select « Units » uses the « * » sign to multiply and select « Unit Price » and click « OK ».
Now, you can see that your measure « TotalSales » in the « Measure » zone.
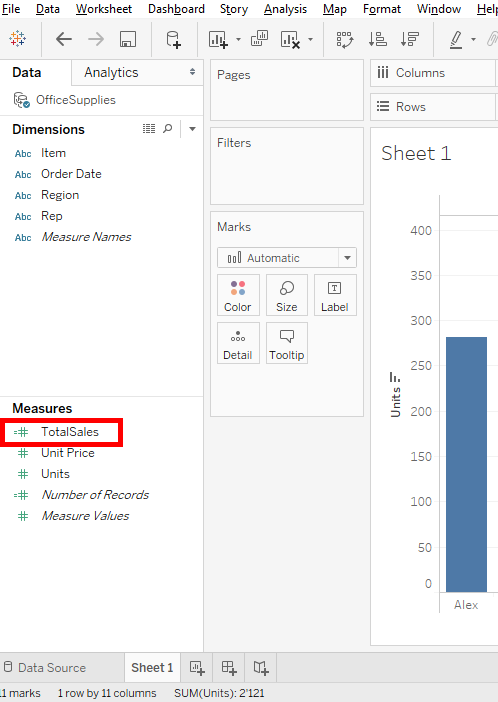
By looking good, you can see that there is an « = » sign before the « # ». This is to indicate that this measure is a calculated field.
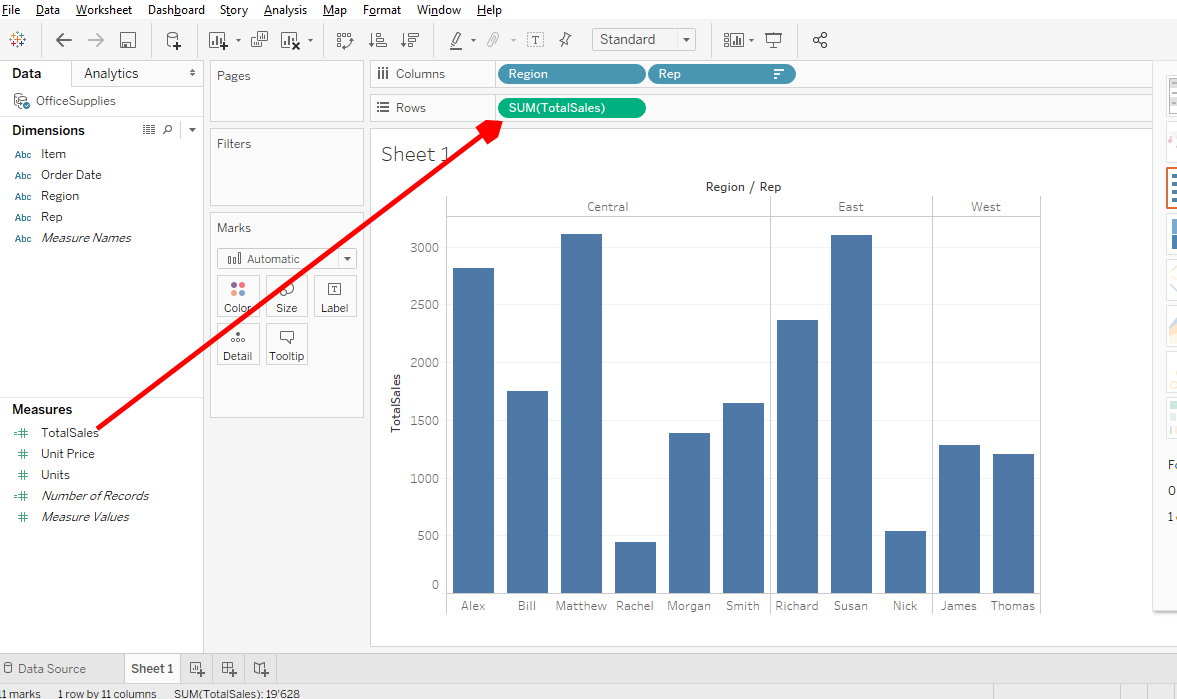
Ok, the measure is ready, let’s go. Put « TotalSales » on « Units » to replace « Units » with « TotalSales. Tableau automatically takes the sum aggregate.
If you want to do this more cleanly, you can remove « Units » by dragging it outside « Rows », then take « TotalSales » and put it in « Rows ».
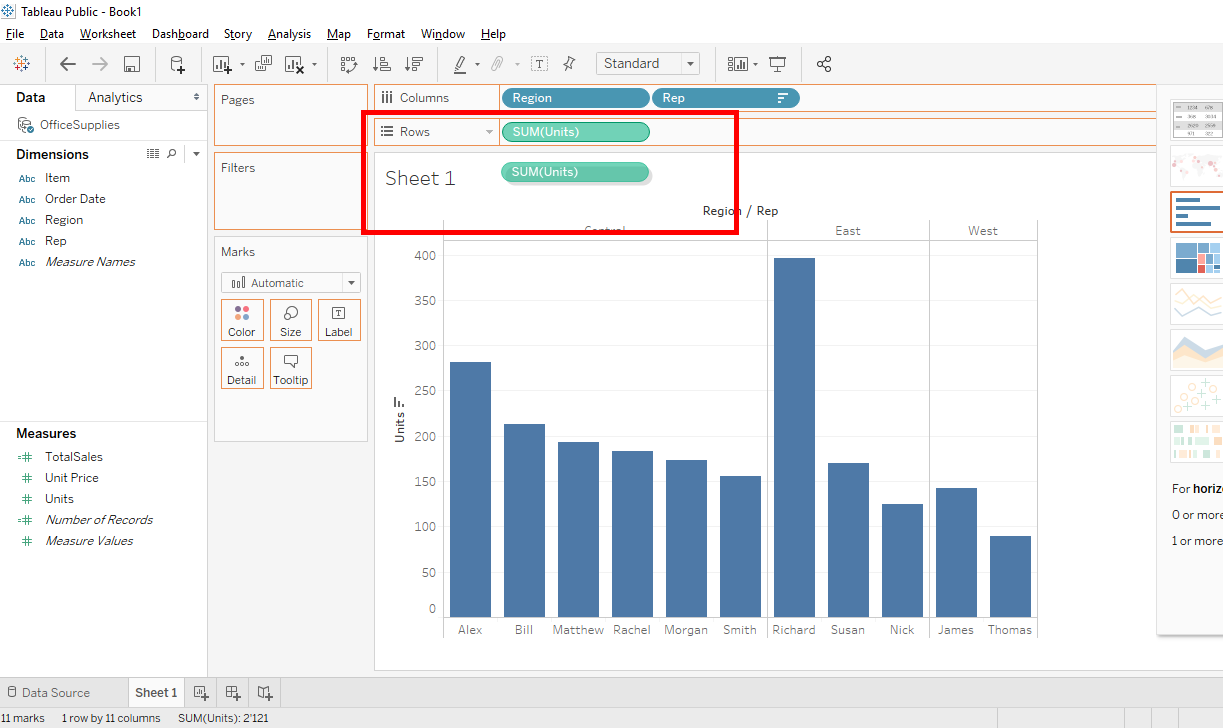
Now, that we have a « Bar Chart » with data from « TotalSales », we sort the bars in descending order by clicking here.


As you can see, the results are different because Richard is no longer the best representatives in the East, it’s Suzanne. The best representative in the East is Suzanne, the best representative at the Center is Mathiew and the best representative in the West is still James.
it’s with the calculated field « TotalSales » that we can know who are the best representatives by region so Suzanne, Mathiew and James earn a bonus.
This was an example to learn how to create a calculated field in Tableau. Have fun creating new calculated field to master this tool that is really useful.
Share this article if you think it can help someone you know. Thank you.
-Steph