I have just enrolled in a Data Science course on Udemy and I learned good stuff.
We’ll learn how to duplicate a bar char to create a new A/B test. We’ll create several A/B test to look for anomalies.
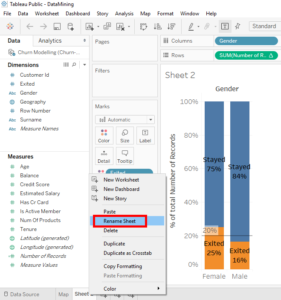
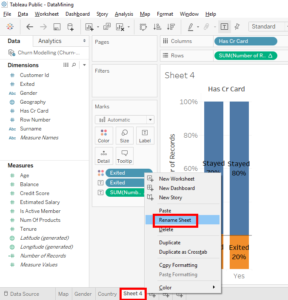
But before that, we’ll name the sheet. Right-click on the tabe and select « Rename Sheet ».
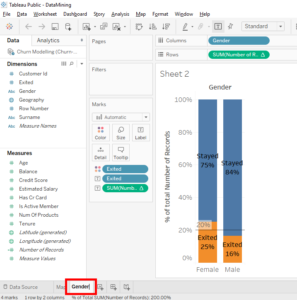
Rename the sheet « Gender ».
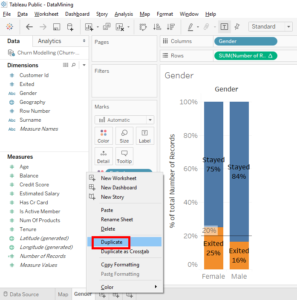
Now right-click on the « Gender » tab and select « Duplicate ».
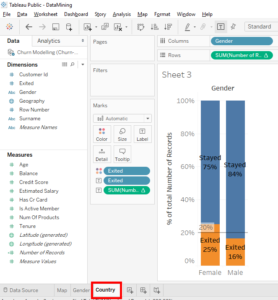
Rename this new tab « Country ».
We’ll do an A/B test with the countries and we’ll reuse everything we did with the A/B test « Gender » to save time.
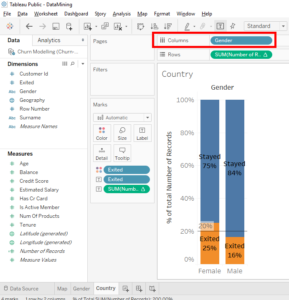
As you can see « Gender » is in « Columns ».
To use this A/B test with a variable other than « Gender », move the variable you want on top of « Gender » in « Columns ».
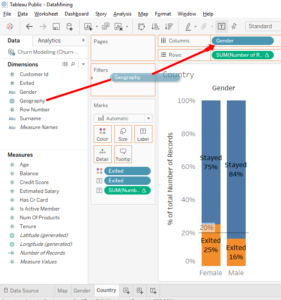
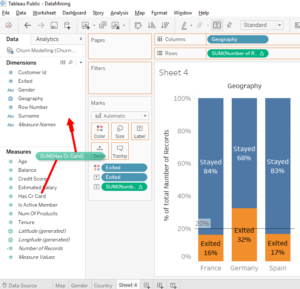
Go, go ! There is « Geography » in « Dimensions », takes « Geography » and puts it on « Gender ».
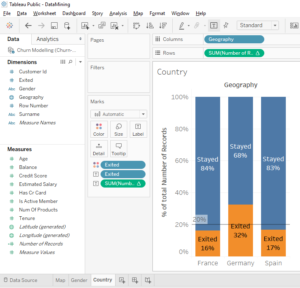
Boom with 1 click we have our A/B test for countries.
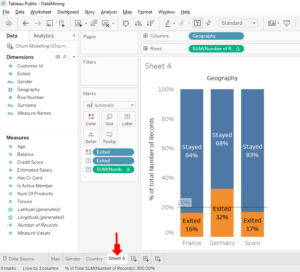
We have the percentage of clients who left and stayed in the bank for each country (Germany, Spain and France).
In this A/B test we can see that in Germany, many clients left the bank with a rate of 32%. For Spain and France, the rate of clients who left the bank is below the average departure rate (20%), 17% for Spain and 16% for France.
Already, we have interesting insigns. We can find out if in Germany there is a new aggressive competitor with more interesting offers or if there is a new law unfavorable to the bank’s offers that has been voted. It’s necessary to do reseach in Germany to find the reason for this high rate of departure.
You have seen, usually an A/B test has 2 categories but in our case, there are 3 categories. We could call it an A/B/C test but it’s a bit bizarre. When there are more than 2 categories, we call it a classification test.
In this article, I will continue to use the term A/B test but remember the term classification test for the next time.
Let’s do another A/B test quickly.
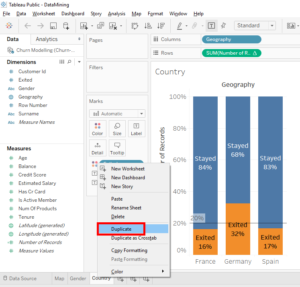
Duplicate this A/B test by right-clicking on the « Country » tab and selecting « Duplicate ».
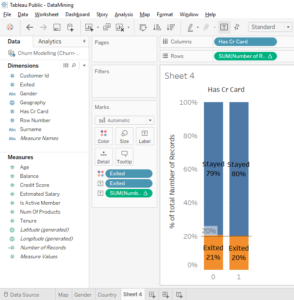
This time we will study the variable « Has Cr Card ». This variable is « 1 » if the client has a credit card and « 0 » if the client doesn’t have a credit card.
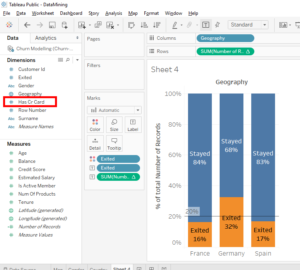
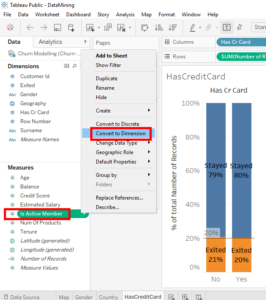
You saw ? This variable is a categorical variable because it is binary « 1 » and « 0 » but it is in « Measures ». Since this variable is categorical, it should be in « Dimensions » so we will move the variable « Has Cr Card » from « Measure » to « Dimensions ».
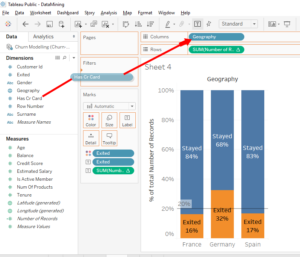
Now that it’s done, move « Has Cr Card » over « Geography » in « Columns ».
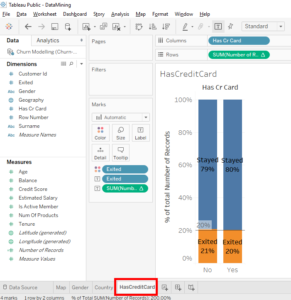
It’s cool, we have a new A/B test for credit cards. What we can observe in this A/B test is that there is not a big difference between the departure rate of clients who don’t have a credit card (21%) and the departure rate of clients who have a credit card (20%).
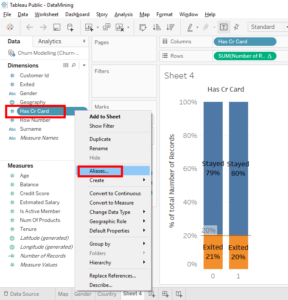
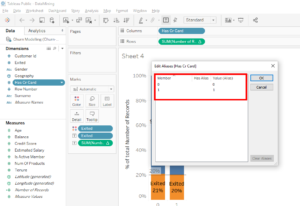
It’s time to create aliases for this A/B test. Right-click on « Has Cr Card » and select « Alias…. ».
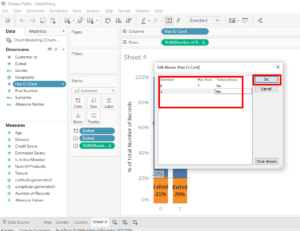
To start, « 0 » means that the clients don’t have a credit card so in « Value », you write « No ». « 1 » means that the clients has a credit card so in « Value », you write « Yes ». Then you click on the « OK » button.
That’s it, the bar chart is easy to read now. We understand that among clients who don’t have a credit card, 21% left the bank and among clients who have a credit card, 20% left the bank. We can conclude that having or not having a credit card doesn’t have a significant impact on the decision to leave the bank.
It’s time to rename this tab. Right-click on the « Sheet4 » tab and select « Rename Sheet ». Name the sheet « HasCreditCard ».
Let’s go, let’s do another A/B test with another variable. Let’s look at « Measure » and study the variable « IsActiveMember ».
The variable « IsActiveMember » is « 1 », if the client is active and « 0 » it the client is inactive. It’s necessary to detail the definition of IS ACTIVE. IS ACTIVE depends on the criteria of the bank. For example, it could be : « Did the client log in at least once to their bank account last month ? » or « Has the client made at least one banking transaction last month ? », etc.
As you can see, the variable « IsActiveMember » is a categorical variable (binary 1 and 0) so it’s a variable to move to « Dimensions ».
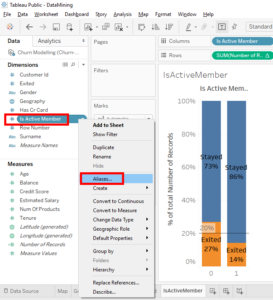
Here’s another way to move a variable from « Measures » to « Dimensions ». Right-click on « IsActiveMember » and select « Convert to Dimensions ».
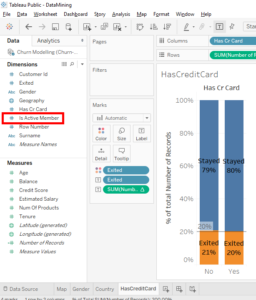
Perfect, the variable « IsActiveMember » is in « Dimensions ».
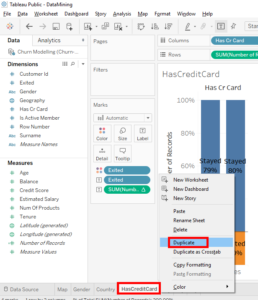
We will duplicate our « HasCreditCard » sheet. Right-click on « HasCreditCard » tab and select « Duplicate ».
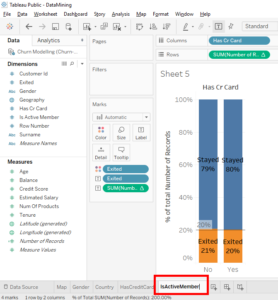
Renamce this tab « IsActiveMember ».
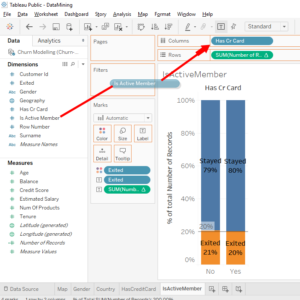
Since we have diplucted what we did with « HasCreditCard », we simply need to take the variable « IsActiveMember » from « Dimensions » and more that over « HasCrCard » in « Columns ».
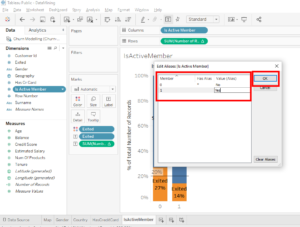
Let’s create aliases to make reading this bar chart easier. Right-click on « IsActiveMember » and select « Aliases… ».
For « 0 », we put « No » because the client is not active and for « 1 », we put « Yes » because the client is active. Click on the « OK » button.
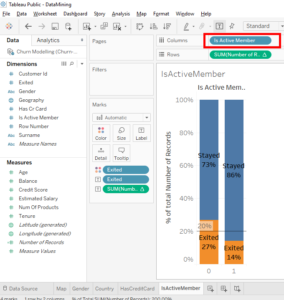
Here is what we can see with this A/B test « IsActiveMember ». Among inactive clients, 27% left the bank. Among active clients, 14% left the bank. This show is that clients who are not active are more likely to leave the bank than active clients.
Indeed, a client who is active means that he/she uses his/her bank account and products of the bank so an active client is satisfied with the bank. It’s possible that some clients leave the bank because of external factors such as a competitor, new regulations or elements of the private life of the client.
It’s cool, we created 4 A/B tests in a few minutes.
-
An A/B test « Gender » that allowed us to see that women were more likely to leave the bank.
-
An A/B test « Country » that allowed us to see that it is in Germany that clients are most likely to leave the bank.
-
An A/B test « HasCreditCard » which allowed us to see that having or not having a credit card didn’t have a significant impact on the descision to leave the bank.
-
An A/B test « IsActive Member » allows us to see that client who aren’t active are more likely to leave the bank .
I will leave you a homework. You’ll do an A/B test with the variable « Number Of Product » which is still a category variable. The variable « Number Of Products » indicates the number of product that the client has in the bank. Add aliases to make reading the bar chart easier.
I trust you I’ll give you the answer in th next article,
Share this article if you think you can help someone you know. Thank you.
-Steph

