I have just enrolled in a Data Science course on Udemy and I learned good stuff.
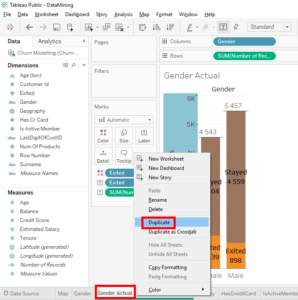
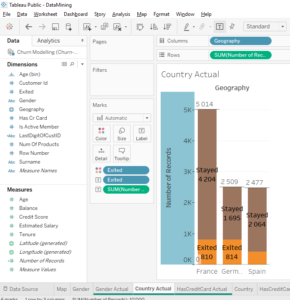
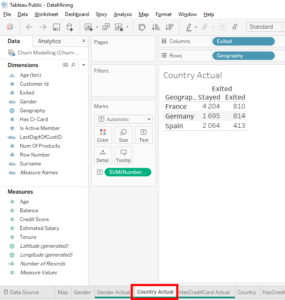
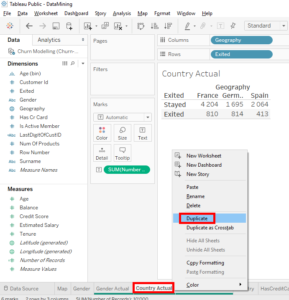
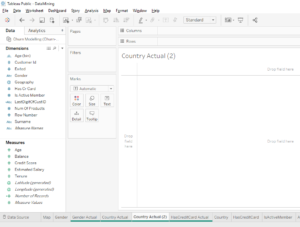
In this article, we will do a Chi-square test with more than 2 categories. We will use the A/B test « Country » which has 3 categories which corresponds to 3 countries : German, Spain and France. Select « Gender Actual » tab, make a copy with a right-click and select « Duplicate ».
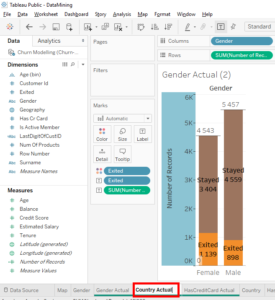
Name the tab « Gender Actual (2) » by « Country Actual ».
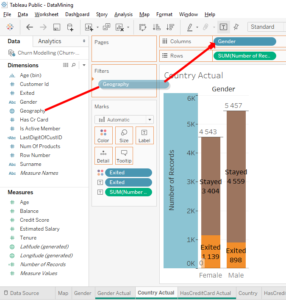
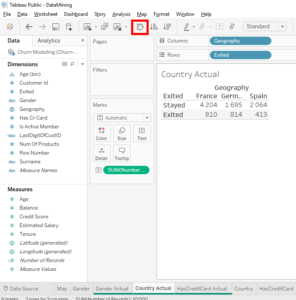
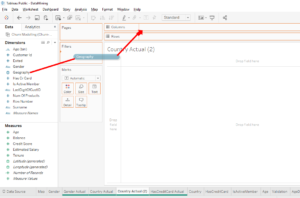
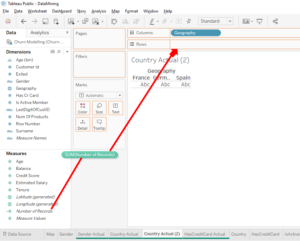
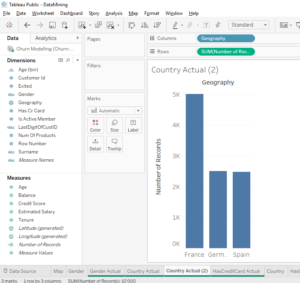
In « Dimensions », move the variable « Geography » over « Gender » in « Columns » to replace « Gender » with « Geography ».
Here’s how to do an A/B statistical test when there are 3 categories. We’ll start with the classic method and then I’ll show you another way to do Chi-square test with any number of categories.
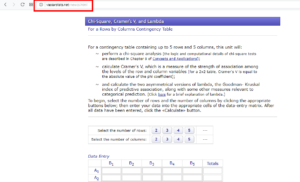
Let’s start with the classical method. In this case, there are 3 categories so we can’t use the online tool of the previous article. In the previous article we used an online tool with only 2 categories « Sample1 » and « Sample2 ». That’s why we’re going to use another online tool, click here .
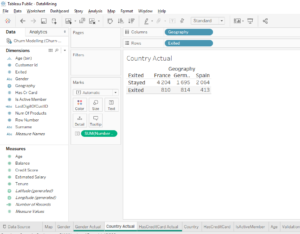
In this online tool, we can enter the values without using the total values. That is, we enter only the number of observations in each category. We simply need to enter the values that are on our A/B test. And I’m going to show you how to turn our A/B test into a table. In this way, it will be easier to enter the values in the online tool without making any mistakes.
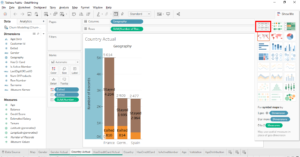
Go to the « Show me » tool at the top right.
Click on « text tables »
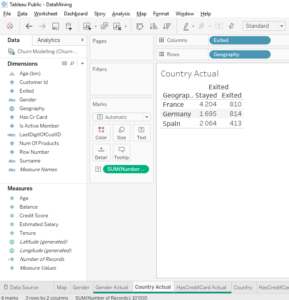
Click on « Swap Rows ans Columns » button.
Cool, now you have a table arranged in exactly the same way as the online tool.
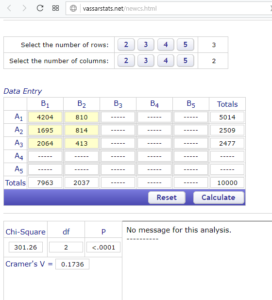
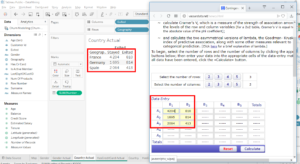
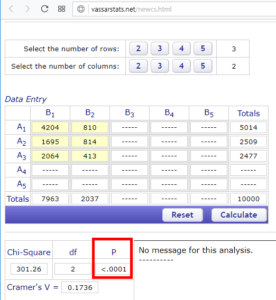
In the online tool, we will select 2 rows and 3 columns.
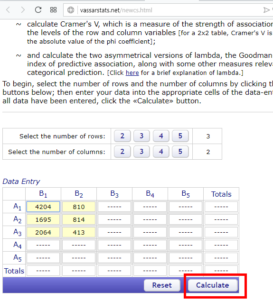
As we have 3 categories and 2 possible results, we enter our values exactly as in the table we just created on Tableau.
Perfect, our table is ready. You can click on the « Calculate » button.
As you can see, we observe the same thing as the other online tool. There is our indicator « p » value which is less than 5%. Which means there is a meaning.
This statistical significance means that these results are valid for the total number of the bank’s clients and not just for the sample of 10 000 clients. We observe similar differences with A/B test « Country » whose results are based solely on the sample of 10 000 clients. We can conclude that in the total number of the bank’s clients, it’s the clients in Germany who are more likely to leave the bank. This is how we do things cleanly.
You saw, this online tool limited by 5 by 5 tables so you can’t use this tool when you have 6 categories or more. But fortunately it’s possible to do Chi-square test with any number of categories. It’s a special method and for you to understand that, I’ll give you a theoretical explanation.
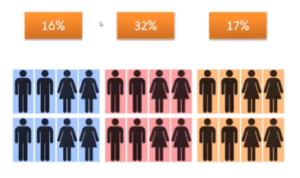
Here we have 3 countries : German, Spain and France.
What we’re trying to compare is the clients number leaving the bank in each of these countries.
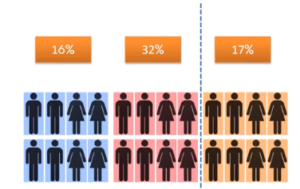
With our basic A/B test based on a sample of 10 000 clients, we obtained 16% for France, 32% for Germany and 17% for Spain. Now the question is : « Do we observe the same results on the total clients number of the bank ? », it means : « In general, does the country have a significant effect on the clients number leaving bank ? ». Germany has the largest number of clients leaving the bank so the idea is : « Why would we need to compare the 3 countries at the same time ? ».
If we do an A/B test statistical test with Germany and France and we get a significant difference in the clients number leaving the bank between these 2 countries, then that would mean that in general, the country has a significant effect on the clients number who bank. Indeed, if we find by comparing Germany and France that the Germans are more likely to leave the bank than the French, we can consider that Spain will not change anything. Germans will always be more likely to leave the bank than the French. Maybe there will be a different relationship between Germany and Spain but there will always be a statistically significant difference between France and Germany with a larger number of clients leaving the bank in Germany than France.
Here is a way to confirm that this logic is true. There is a test and the participants of this test are German, Spanish and French. Imagine that this test was done without looking at what is happening in Spain. Now you get the result and you ask yourself the question : « Would the results changed if you added Spain ? ». The answer is « no » because there is no interdependence between Germany, Spain and France. That is, the decision to leave the bank in France and Germany doesn’t depend on Spain. And therefore, it’s quite correct to separate the categories by putting 1 aside to compare the 2 others. And as now we have 2 categories, we can do a Chi-square test with the online tool that we used in the previous article.
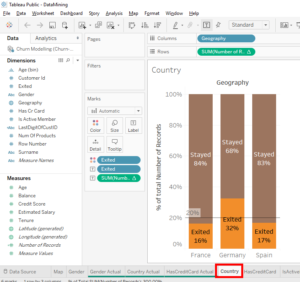
So let’s go back to our worksheet and put a country aside to compare only 2 countries. Select « Country » tab.
What we observe is that the difference between Spain and France is very small, so it wouldn’t be interesting to do a Chi-square test between Spain and France. It’s more interesting to do a Chi-square test between Germany and France and to prove that there is a statistically significant difference between these 2 countries. This will be enough to conclude that the country has a statistically significant impact on the clients number who leave the bank.
Selects « Country Actual » tab.
We will use the online tool of the previous article, click here .
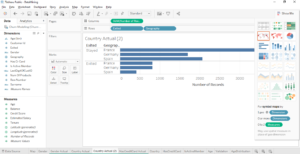
We will make a copy of « Country Actual » to have a bar chart with absolute values. Select « Country Actual », right-click and select « Duplicate ».
In « Show Me », select « horizontal bars ».
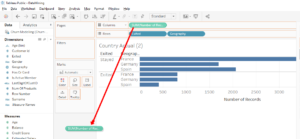
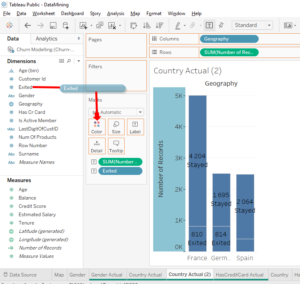
Removes « SUM (Number of Records )» from « Columns » and removes « Exited » and « Geography » from « Rows ».
In « Dimensions », move « Geography » in « Columns ».
In « Measures », move « Number of Records » to « Rows ».
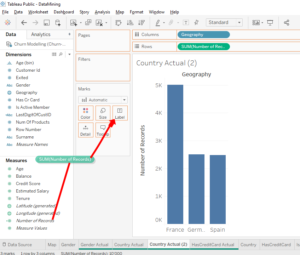
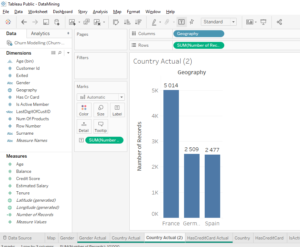
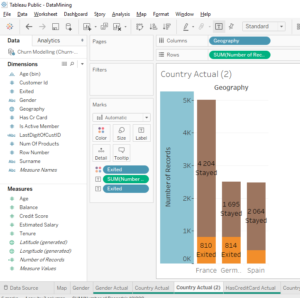
In « Measures », move « SUM(Number of Records) » in « Label ».
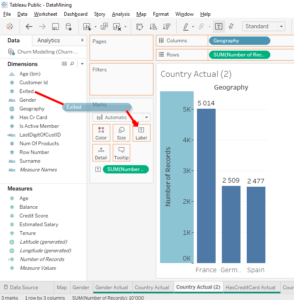
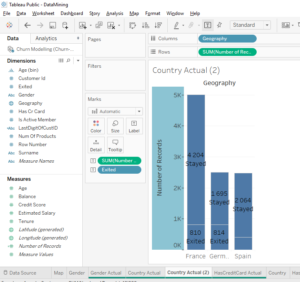
In « Dimensions », move « Exited » in « Label ».
In « Dimensions », move « Exited » in « Colors ».
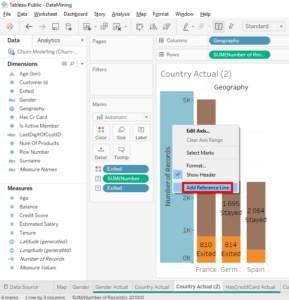
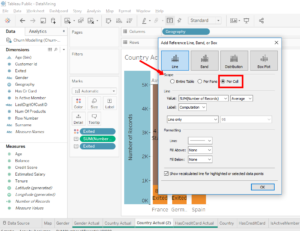
We also need total absolute values, which means the total number of men and women. There is a very fast way to get that. Right-click on the vertical axis and select « Add Reference Line ».
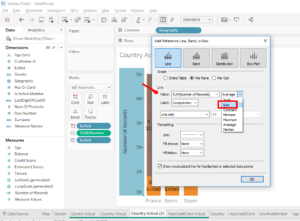
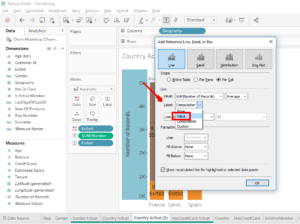
Then in « Value », click on the drop-down on the right and select « Sum » to have the total sum of the observations.
And in « Scope », you select « Per Cell » option to specify that you want the total sums for each category, male and female.
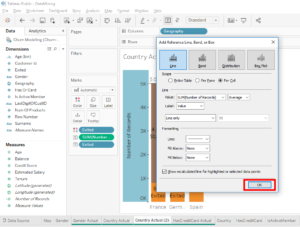
Now, we have the total sum at the top of the bars. We will modify labels to have the absolute values. In « Label », we will change « Computation » to « Value » and click on the « OK » button.
Here’s how to enter the data :
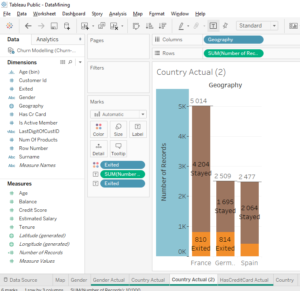
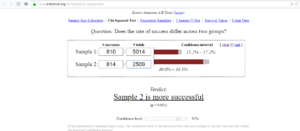
For « Sample1 » in #success, you enter 810 because there are 810 people who left the bank. For « Sample1 » in #trials, you enter 5014 because there are 5014 people in total.
For « Sample2 » in #success, you enter 814 because there are 814 people who left the bank. For « Sample2 » in #trials, you enter 2509 because there are 2509 people in total.
Here is the verdict : « Sample2 is more successful ». « Sample2 » corresponds to German’s clients and #success is :« yes, the client left the bank ». This verdict means that of all the clients from German are more likely to leave the bank than clients from France. And look, there is something important, it’s « p<0.001 ». This means that the « p » is strictly less than 0.001. As you can see, « p » value is very small, which concludes that the tests are statistically significant.
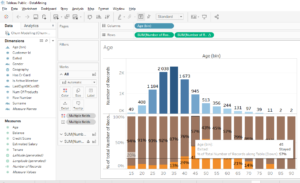
Ooh, there’s another thing I wanted to show you with the tab « age » with the 2 bar charts in parallel.
As you can see, there are many categories (more than 5) because each category corresponds to a 5-year ago group with clients of the bank aged from 15 to 90 years old. This is a lot of comparison but it would be a good exercise for you to find what are the 2 categories to compare that shows that there is a significant statistic difference.
I give you a hint, compare slices from 50 to 54 years old or from 35 to 39 years olds. In fact, you should compare all peer categories where you observe difference on this basic A/B test. Do a basic A/B test with absolutes values. Then do a Chi-square test to check if the difference is statistically significant, I mean, if the result is valid for the total number of bank’s clients.
This is a way to statistically validate the insights we see onTableau. You see, it’s not very difficult and it’s effective. Here is a way to find insights on Tableau and validate them.
Subscribe to my newsletter and share this article if you think it can help someone you know. Thank you.
-Steph
