I have just enrolled in a Data Science course on Udemy and I learned good stuff.
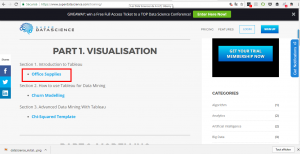
This is the 1st challenge. Use your web browser to go to superdatascience website to download a data set. In the « Part 1 Visualization » section, click on « Offices Supplies » to download the file « OfficeSupplies.csv ».
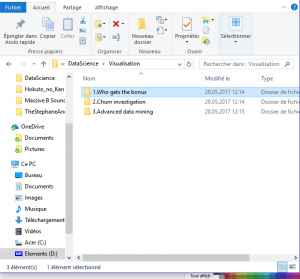
To organize myself, I created a folder « Visualization » with 3 subfolders. Each subfolder corresponds to the section of « Visualization ». I put the data set « OfficeSupplies.csv » in the 1st subfolder.
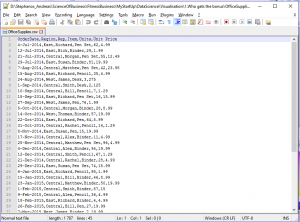
« OfficeSuplies.csv » is a CSV file. A CSV file is a text file that represents an table but the elements separated by comma.
You can open this CSV file with NotePad++ for PC or with Sublime Text for Mac.
On the 1st line (column title), we see that we have 6 columns. Each column separated by a comma and the file contains 44 lines.
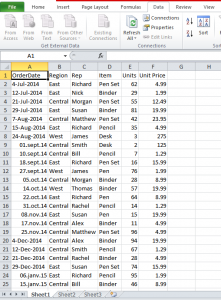
You can also open a CSV file with Excel, OpenOffice or LibreOffice to have a table, which is easier to read.
To open a CSV file with Excel, here are the instructions :
-
Open a blank workbook
-
Go to Data tab
-
Click button « From Text » in the general external data section
-
Select your CSV file
-
Follow the Text Import Wizard (in step 2, select the delimiter of your text).
This data set contains data from a store that sells office equipment :
-
Order date – date of sale
-
Region – The store is in 3 region (East, Central and West)
-
Rep – salesperson’s first name
-
Item – product’s name
-
Units – product’s quantity
-
Unit Price – price per unit
Each line shows how many sales there were for a product.
The challenge is to help the manager to know who made the most sales per region in the period of this data set. The period of this data set is from July 2014 to June 2015.
The person who made the most sales in each region has a bonus and there are 3 bonus so 1 bonus per region.
It’s will this challenge that we’ll use Tableau Public.
Share this article if you think it can help someone you know. Thank you.
-Steph


