I have just enrolled in a Data Science course on Udemy and I learned good stuff.
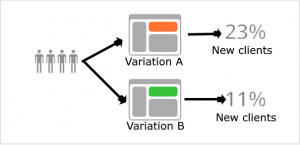
We are going to do a simple and very visual A/B test in Tableau.
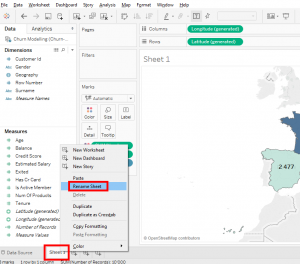
The first thing to do is save this worksheet and name it « Map ».
Do a right-click on « Sheet1 » at the bottom of the screen and select « Rename Sheet ».
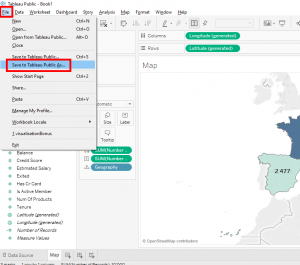
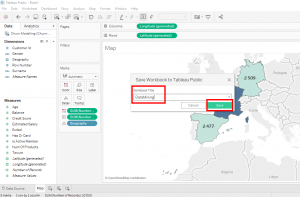
The second thing to do is to save this workbook. For that we go to « File » and select « Save to Tableau Public As… »
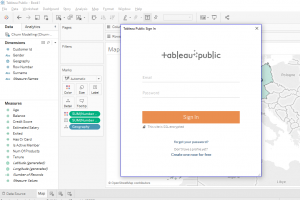
The « Tableau Public Sign In » window appears to connect to your Tableau account.
Save the workbook with the name « DataMining » and click on the « Save » button.
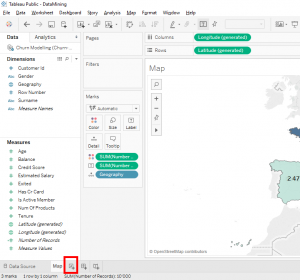
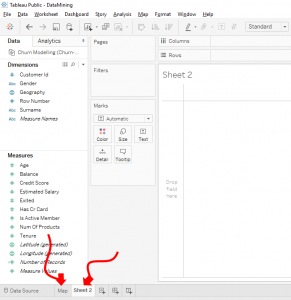
We will create a new worksheet specifically for the A/B test. Click on the « New Worksheet » icon at the bottom of the screen.
Look, you created the new worksheet.
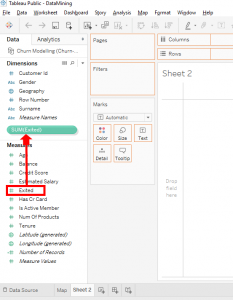
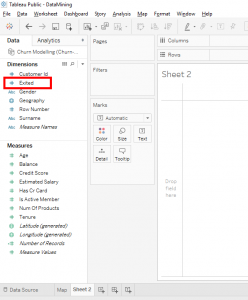
To start we need the dependent variable we are studying. This dependent variable is « Exited » which is « 1 » if the client left the bank or « 0 » if the client stayed in the bank. Now look, this dependent variable is in « Measures » so Tableau recognized this variable as a dependent numeric variable.
For our case, the dependent variable « Exited » is actually a category. Our logic in this situation is : « Did the client leave or did the client stay ?. For this reason, we need to move the variable « Exited » in the dimensions.
Now, the variable « Exited » is in dimensions.
Let’s do a classic A/B test, the A/B test for gender (male or female).Here what we’re going to test, if we keep all the rest constant and if we take a male client and a female client, which of the two is most likely to leave the bank.
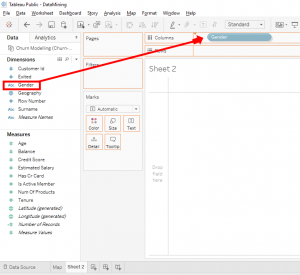
Let’s go, move « Gender » in « Column ».
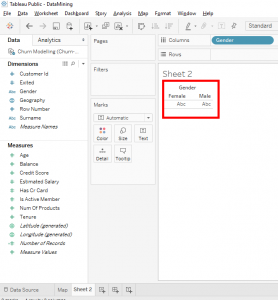
We have 2 columns : « Female » and « Male ».
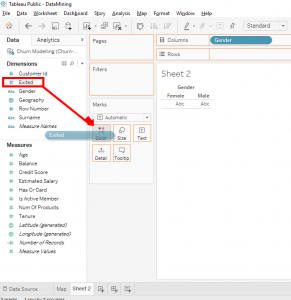
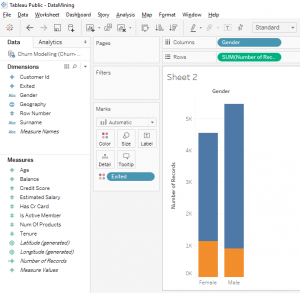
Move « Exited » on « Colors ».
Look, we have 2 colors. Blue for « 0 », it means the clients who stayed in the bank. Orange for « 1 », it means the clients who have left the bank.
To be more specific, we want know how many clients stayed and how many clients left the bank.
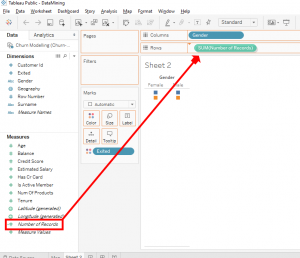
Move the variable « number Of Records » into « Rows ».
What we can notice is that the total number of men is higher than the total number of women. Then we can see that among the women, a large proportion left and that among the men a small proportion left. However, this is not enough to allow us to understand what is happening.
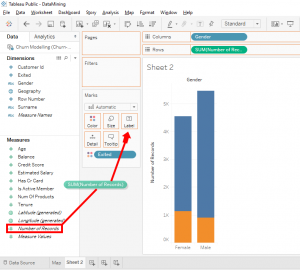
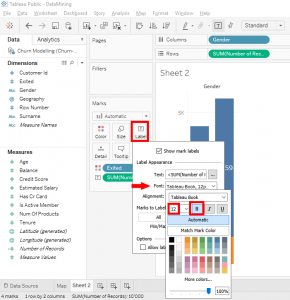
We will add « number Of Record » as a label. Move « number Of Record » to « Label ».
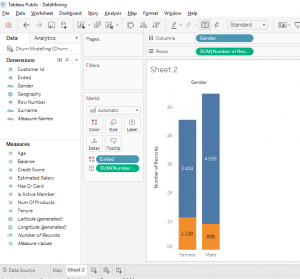
Change the label’s size in « 12 » and bold.
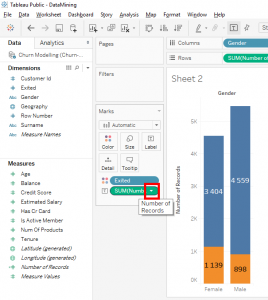
Now we know the number of people in each category.
To better visualize this, we will replace the numbers with percentages. We want to see what percentage of female clients are gone and what percentage of male client are gone. With percentages we can easily make the comparison that with the absolute numbers, it’s not possible because the total number of woman is different from the total number of man.
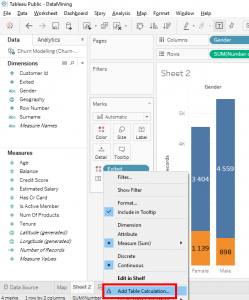
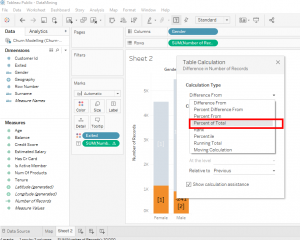
To convert a absolute number to a percentage, you need to click on the arrow next to « SUM(number Of Record) ».
And click on « Add Table Calculation… »
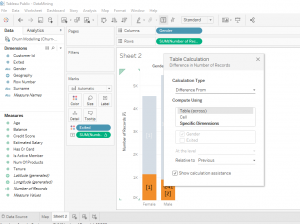
In « Calculation Type », select « Percent of Total ».
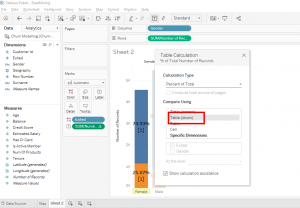
Be careful, here there is one important thing to do. Change « Table(across) » and choose « Table(down) ».
« Table(down) » will give us the total percentage in each column. Now you can close the window, the changes have been made.
Boom, we have the percentages.
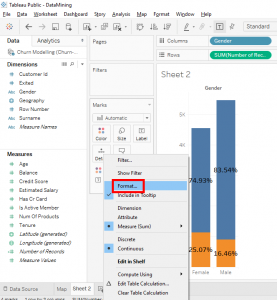
We will create labels to make it easier to read. Click on the small arrow next to « SUM(number Of Record) » and select « Format… ».
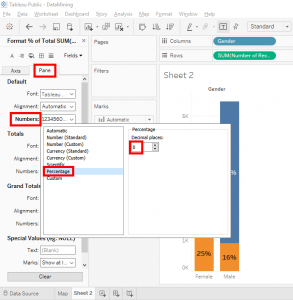
The « Pane » tab appears. In the tab « Pane » in « Numbers », choose « Percentage » and select « 0 » decimal.
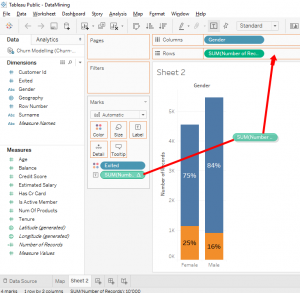
We will make it even more consistent. Move « SUM(number Of Record) » by holding key « Ctrl » or « Command » to « Rows » to replace the old « SUM(number Of Record) ».
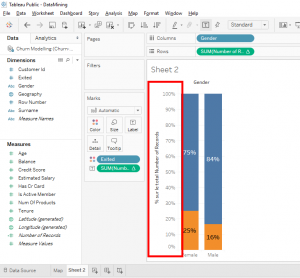
As you can see, the vertical axis is in percentage.
Let’s do an analysis of what we see. We see that the percentage of female clients who left the bank is 25%. We see that the percentage of male clients who left the bank is 16%. What we see that female clients are more likely to leave the bank than male clients, all the rest being equal.
This A/B test is not complete because we have not done any test of statistical significance but this approach is effective for quickly obtaining results.
We’re going to do a full A/B test later but today you learned how to do an effective A/B test by focusing on relevant things. With a test of statistical signifiance, there are irrelevant variables and it takes a little more time but we’ll that later.
Share this article if you think it can help someone you know. Thank you.
-Steph
