

I have just enrolled in a Data Science course on Udemy and I learned good stuff.
Podcast:
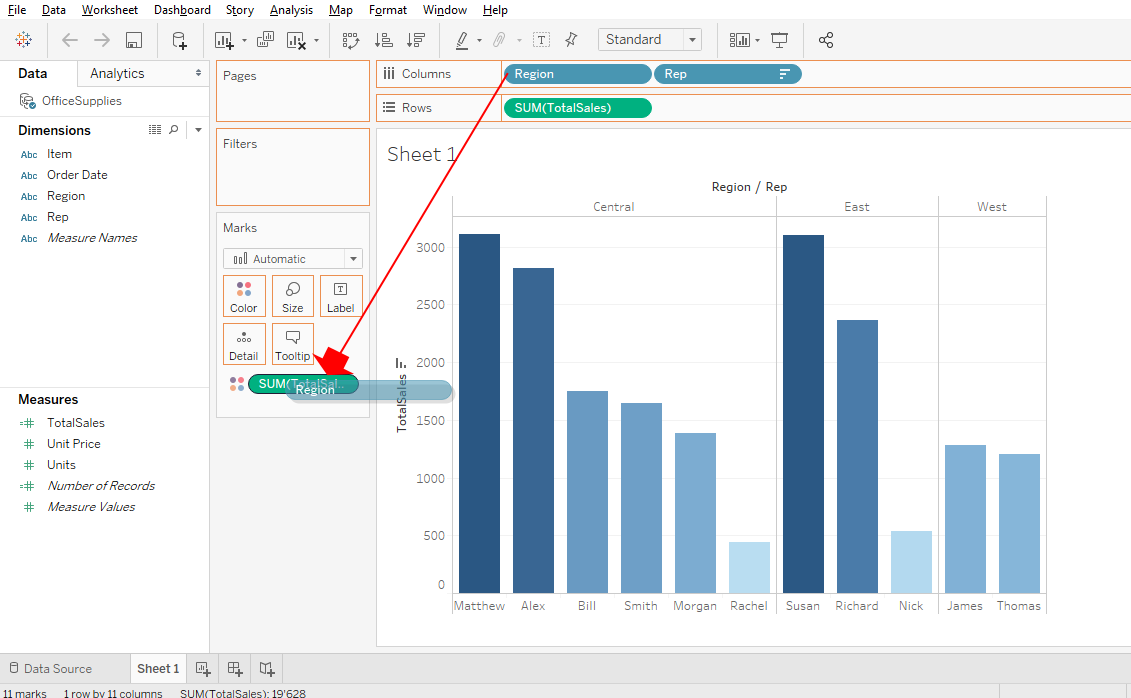
In the last article, we created our calculated field « TotalSales » that you can see in «Measure » zone.
In Tableau, the calculated field is very used (almost every time) because in most case the data don’t give the value you want to show.
The calculated field « TotalSales » is a simple example to make you understand how it works but know that you can do things more complex. I’ll show you that later.
In this article, I’ll show you how to manipulate colors because it’s an important element to communicate. With colors, people will understand more quickly what you want to explain to them.
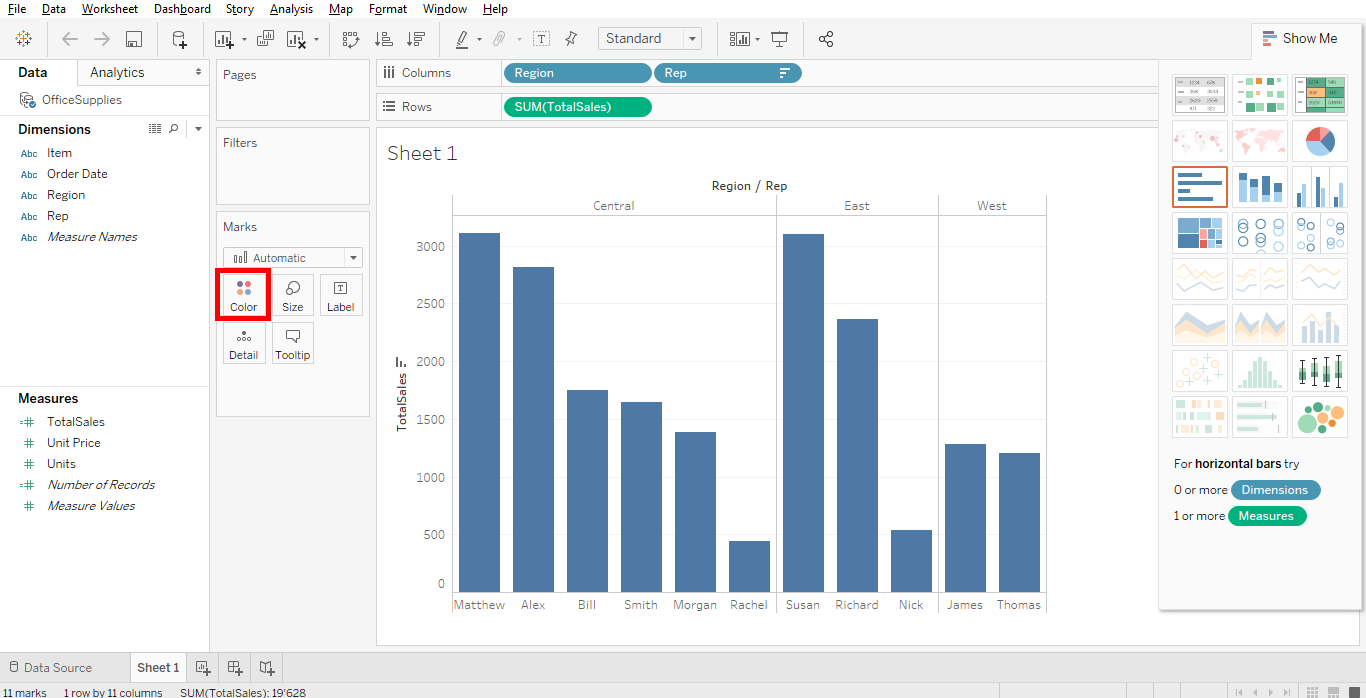
Imagine that you have to show this bar chart to the manager who handles the bonuses. By putting a little color, a little art, you could improve the reading of this bar chart.
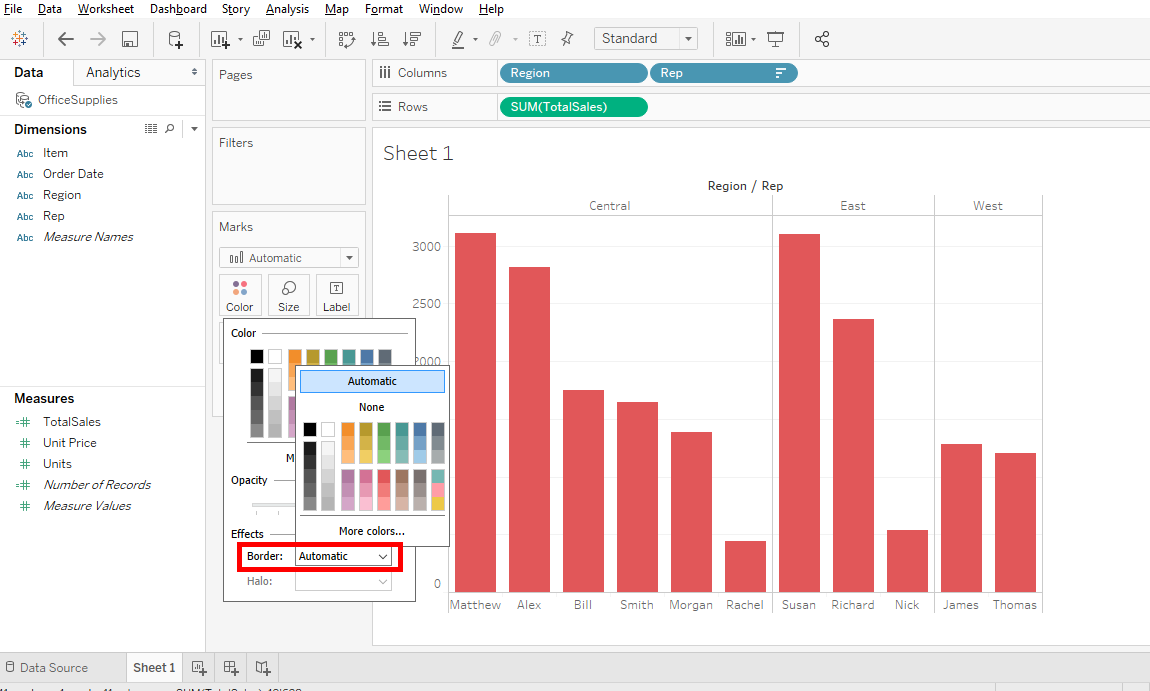
To use colors, click on this button.
You can change the color with the basic colors.
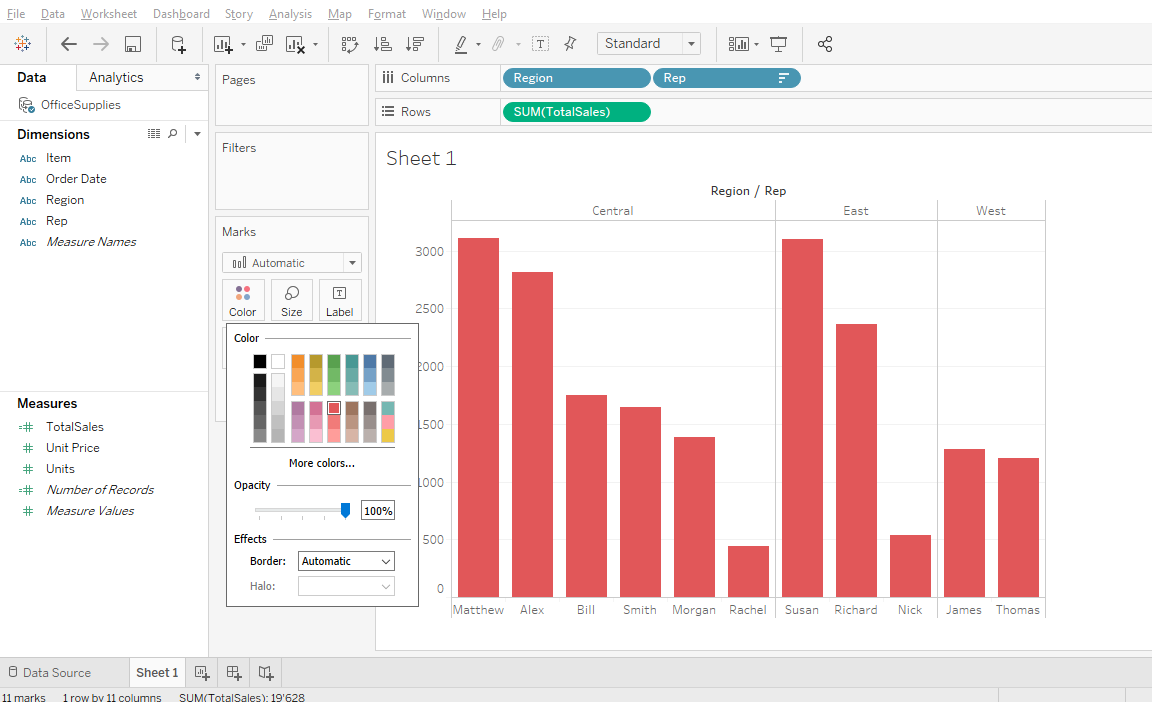
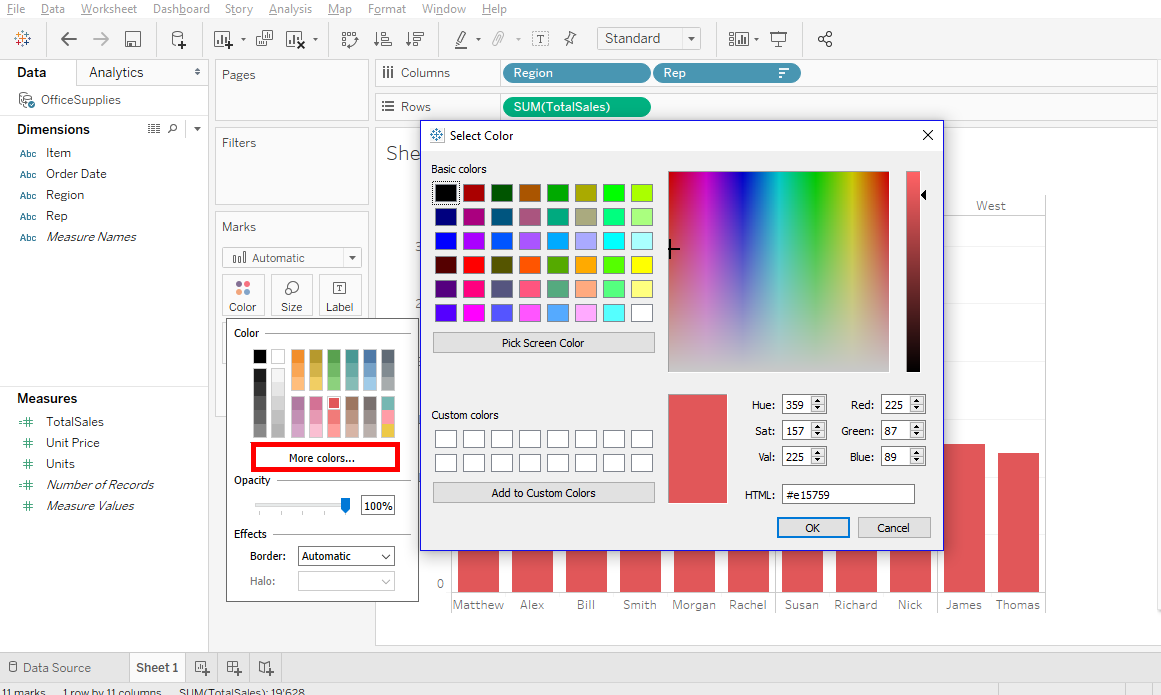
Or you can have more colors by clicking here.
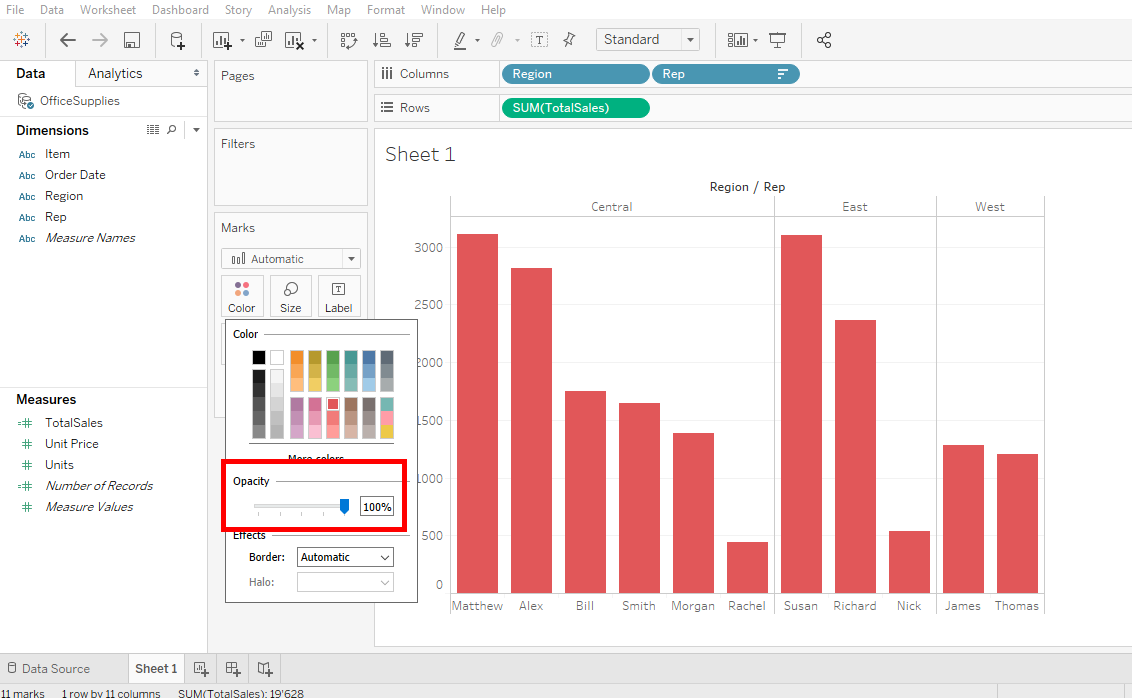
If you have a picture in the background, you have the possibility to change the opacity to have a transparent effect of colors.
You can add a border, change the border’s color, etc.
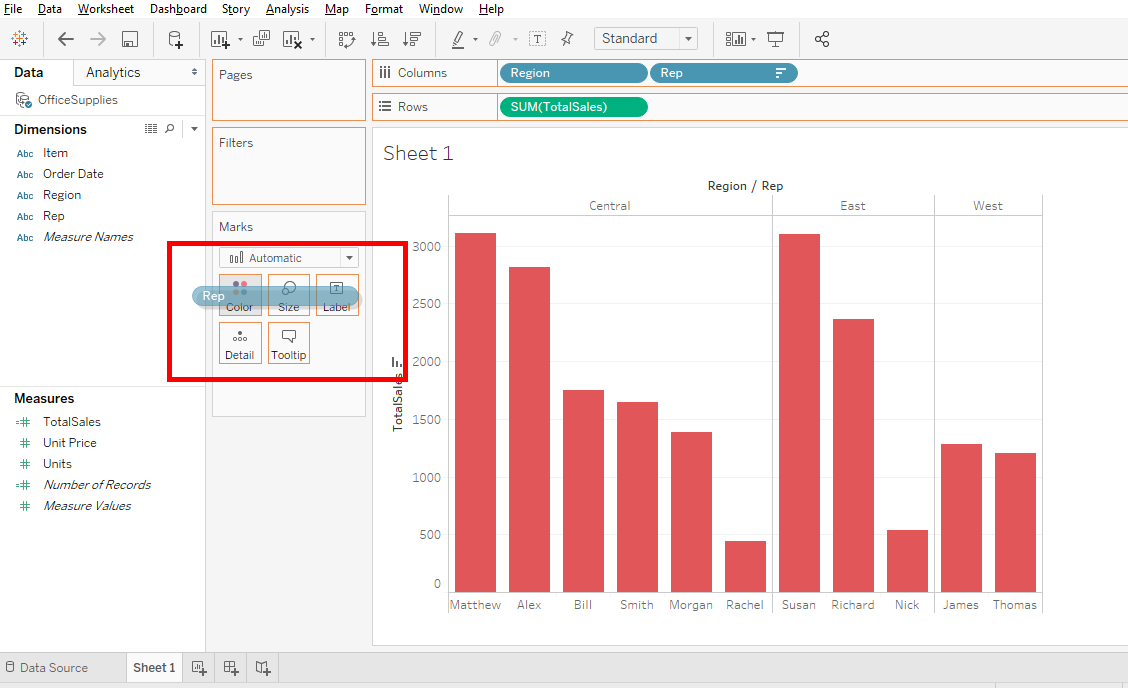
But what would be nice to do is to have bars with different colors.
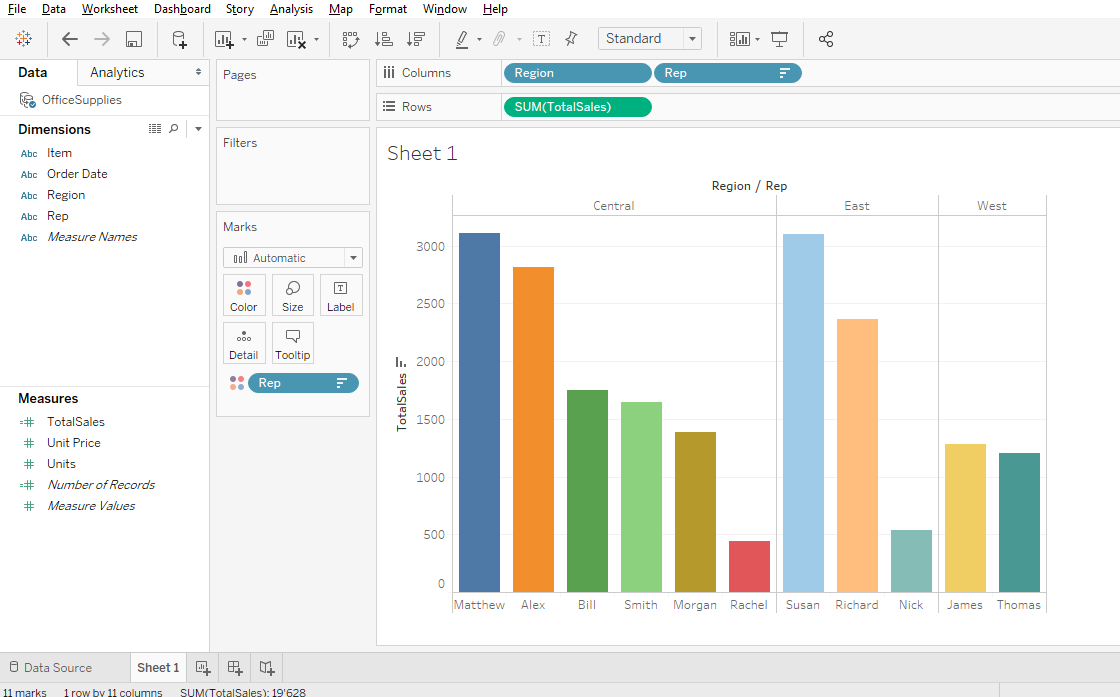
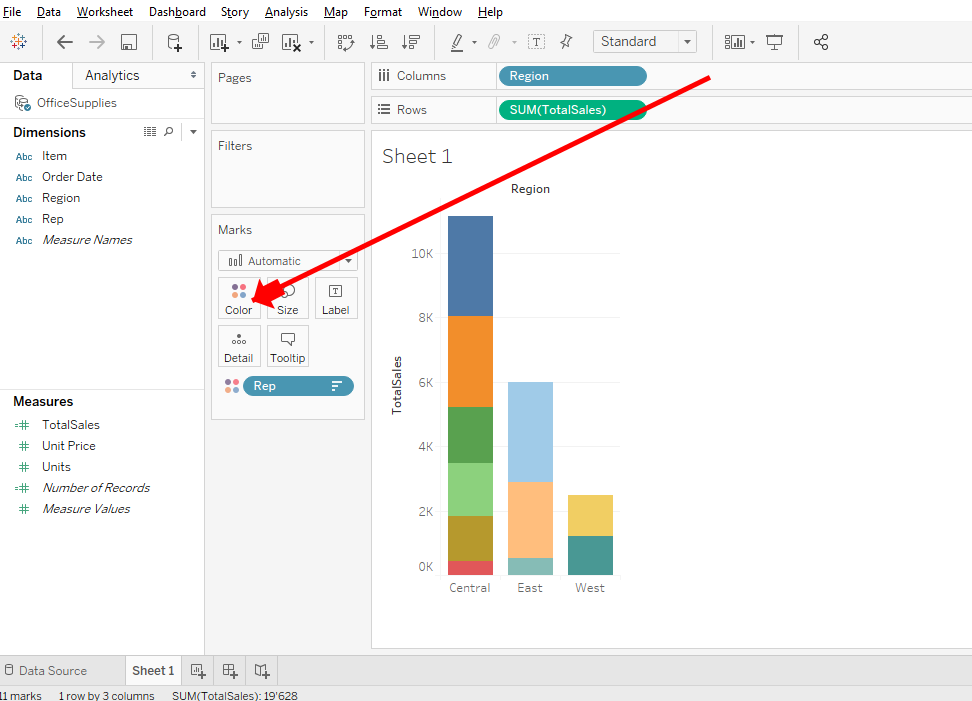
To start, take « Rep » and move it on « Colors ».
With this, there is a unique color for each representative.
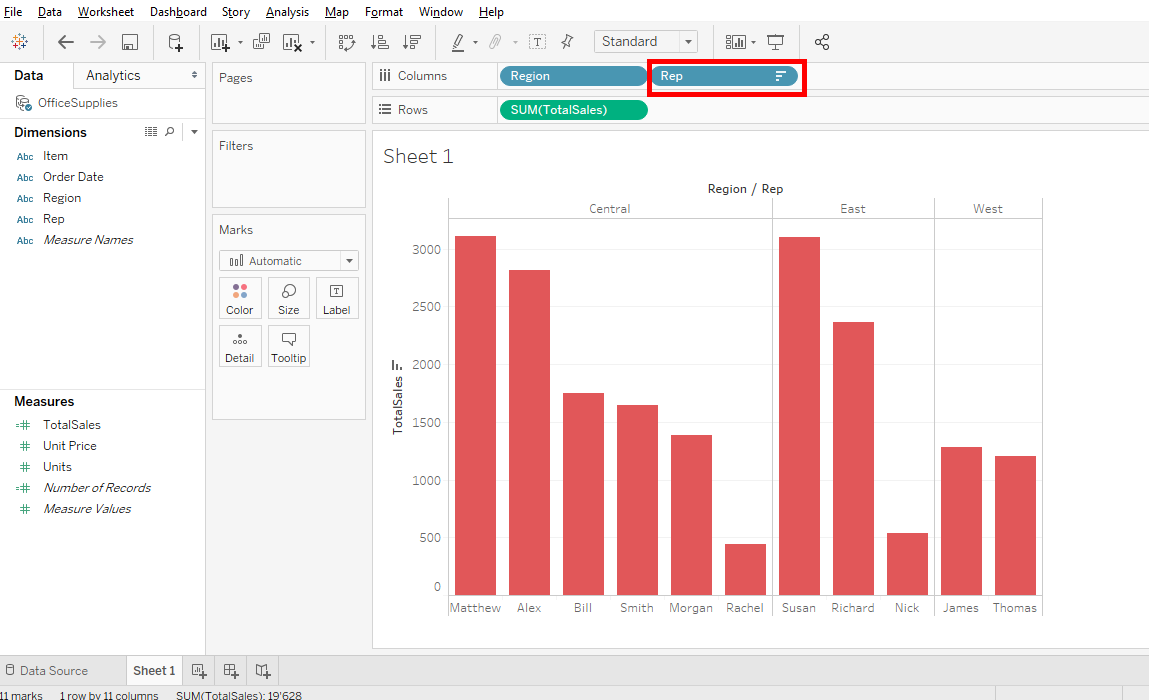
There is also another method to do that. Instead of taking « Rep » and moving it to « Color », you can click « Rep » here.
If you move it to « Colors », you’ll break everything because « Rep » will no longer be in the « Columns » zone.
To avoid this, press Ctrl or Command on your keyboard and click « Rep » to make appear the sign « + ». Now that you made a copy of « Rep », move it to « Colors ». It’s like making a copy/paste from « Rep » to « Colors ».

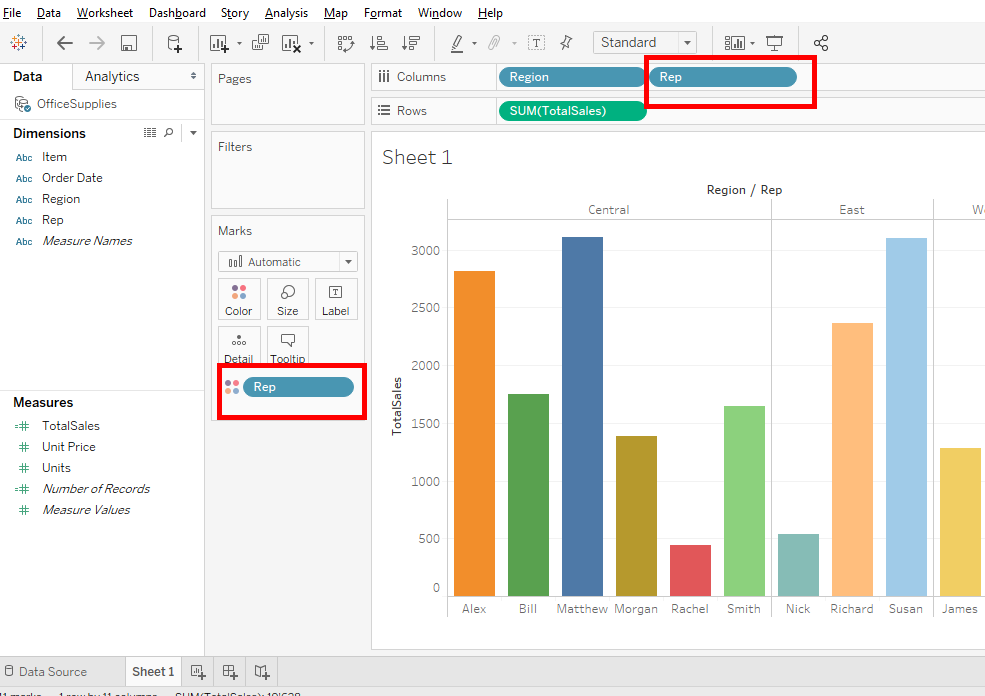
With this method, « Rep » is always in the « Columns » zone. This is a method that is very practical when there are many dimensions.
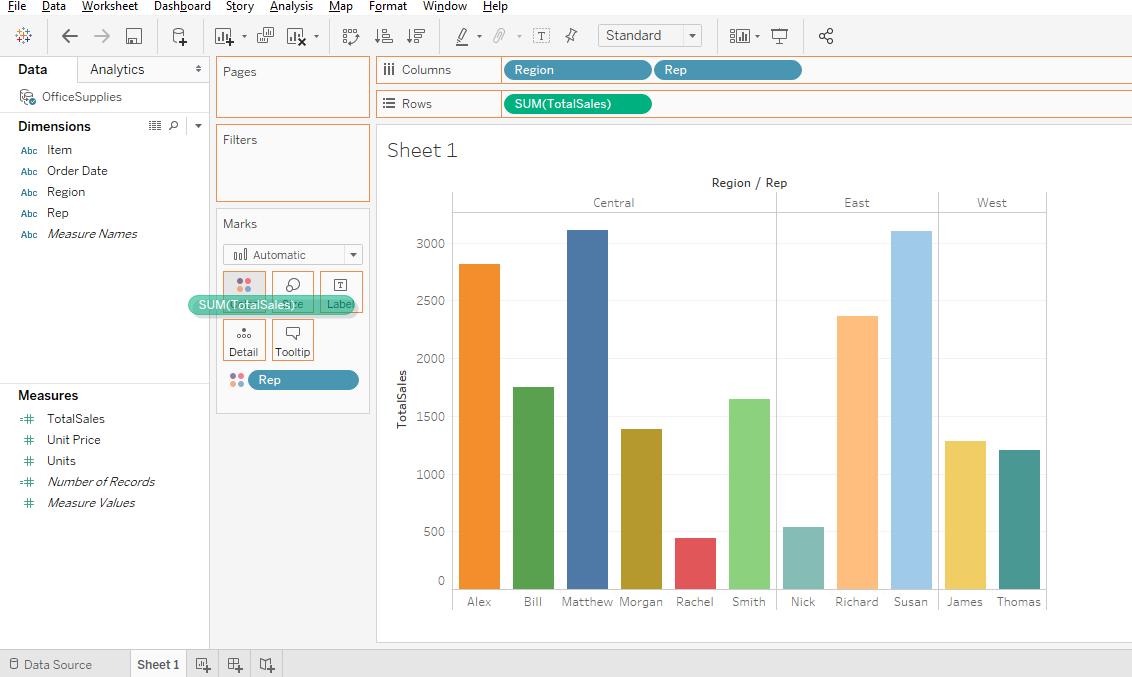
It’s possible to change representative’s colors by clicking here.

As you can see, there are several choices of palettes.

You can test the « color blind » palette which is very useful for color blind people. To select this palette, click « Assign Palette » and « Apply ».
When a palette has fewer colors than representatives, you will have a message saying that some colors will be duplicated. But this is not a problem because there are names below the bars.

Now we want to see something else with our bar chart. Press “Ctrl” or “Command” on your keyboard and click on SUM(TotalSales) to display the « + » sign. Then move SUM(TotalSales) to « Colors » to replace « Rep ».
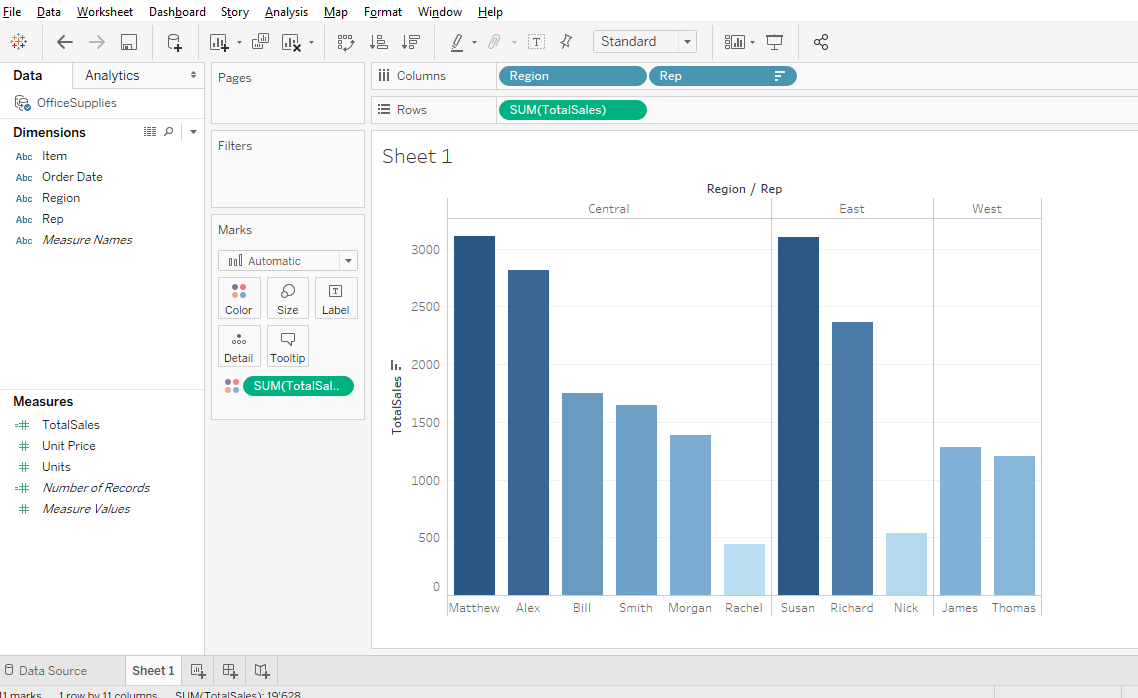
As you can see SUM(TotalSales) has different colors. The colors are on a continuous basis which means that the more sales there are, the darker the color.
For our case, this is not useful because the size of the bars represents the sales number but for other situations, this is useful.
The problem now is that there are duplicate colors and because of this, the Manager could misinterpret the results. An alternative approach would be to ensure that the Manager understands the results.
The solution is to take « Region » (by pressing “Ctrl” or “Command” on your keyboard) and move it to « Colors ».

You can also take « Region » (with “Ctrl” or “Command”) and move it to SUM(TotalSales) to replace SUM(TotalSales).
With that, the bars are colored by region.

That way, you can clearly see the 3 regions through colors that are unique to each region and you can see the total sales per representatives with the size of the bar.
This is a small example so that you can understand the basics to manipulate colors in Tableau. There are still more complex techniques to manage the colors that I will show you later.
Plays with the colors so you can fully understand how it works. You could find your favorite palette and find your style. Have fun.
Share this article if you think it can help someone you know. Thank you.
-Steph