

I have just enrolled in a Data Science course on Udemy and I learned good stuff.
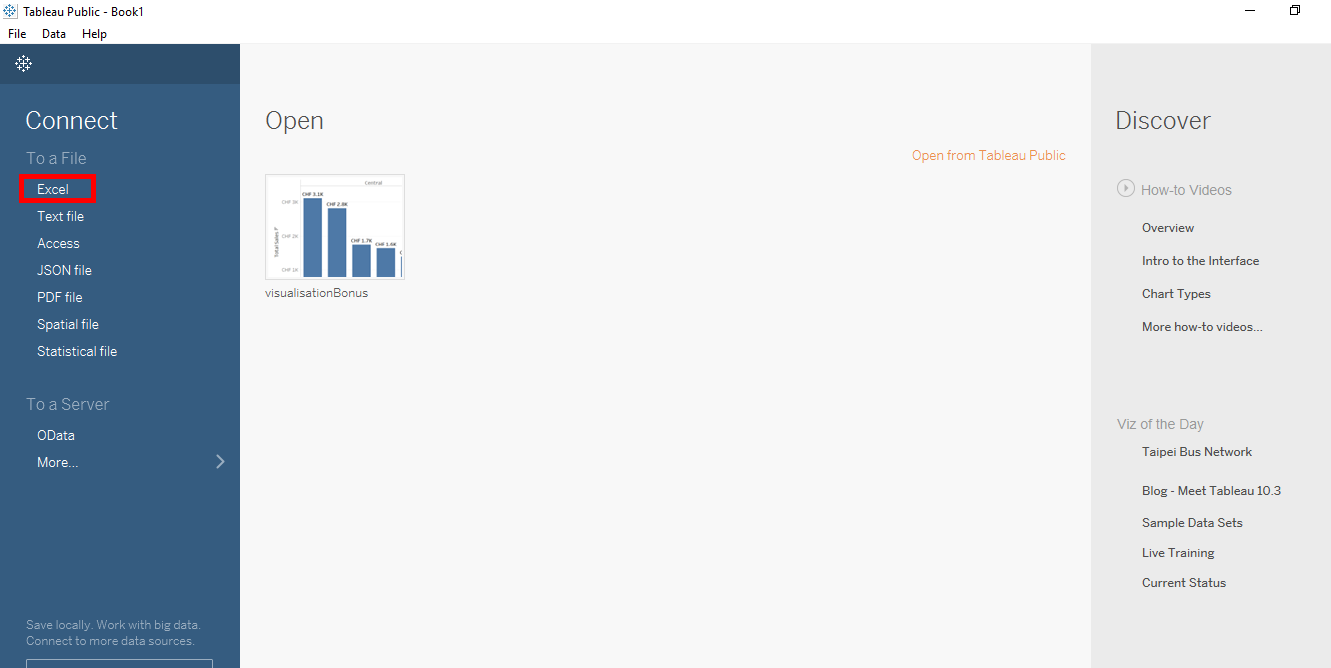
Now that you downloaded the dataset in Excel file format, we’ll use Tableau to analyze this.
We’ll connect to the dataset using the « Excel » option.
Now that you downloaded the dataset which is in Excel format, we will use Tableau to analyze this.
We will connect the the dataset using the « Excel » option.
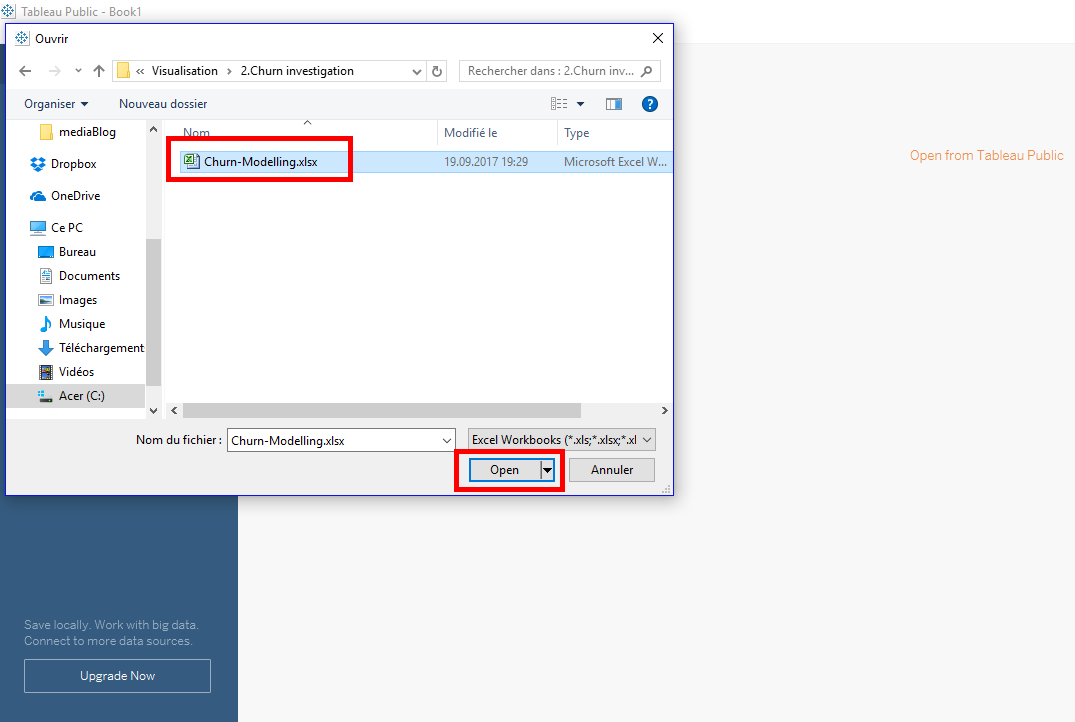
Select the dataset in Excel file you downloaded and click on the « Open » button.
And as you can see, there is only one tab.
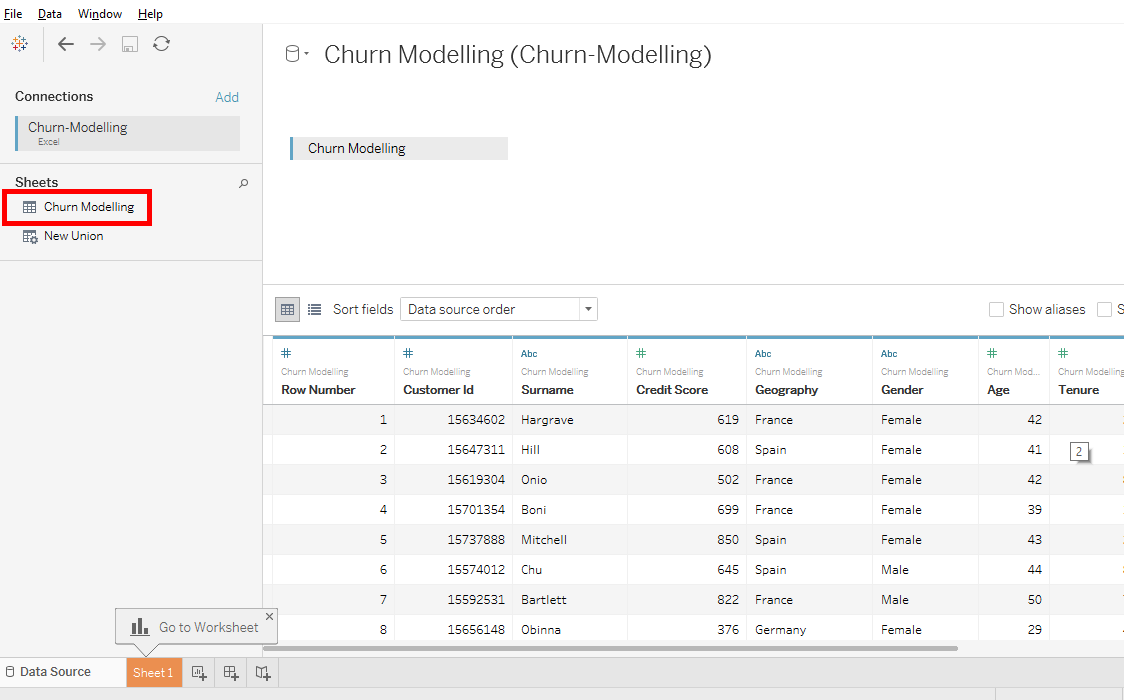
There is only one tab because in the Excel file there is only one tab. If in the Excel file there were several tabs, they would all have been listed here.
It’s necessary to check that all data is « OK ». Scroll the lines and columns to see that. Everything is good, there are 10 000 lines as in the Excel file.
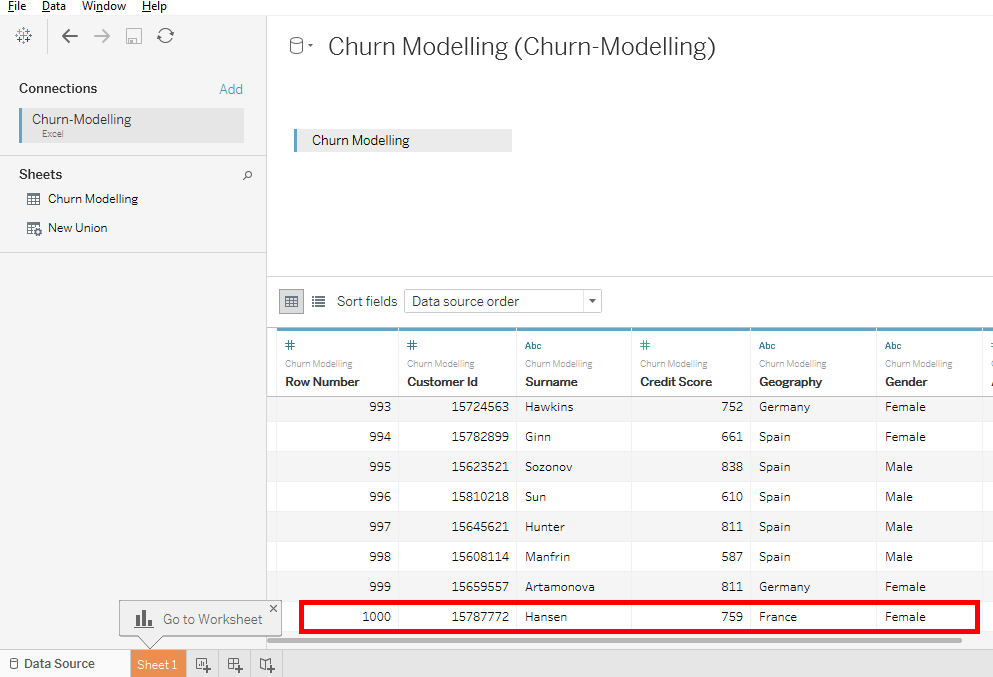
Excellent, we connected our Excel source file to Tableau.
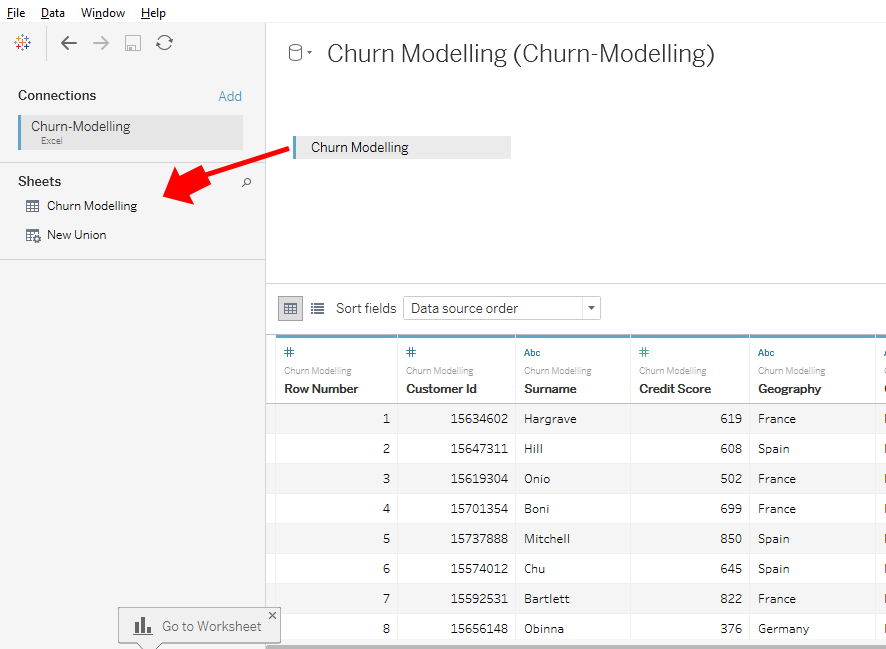
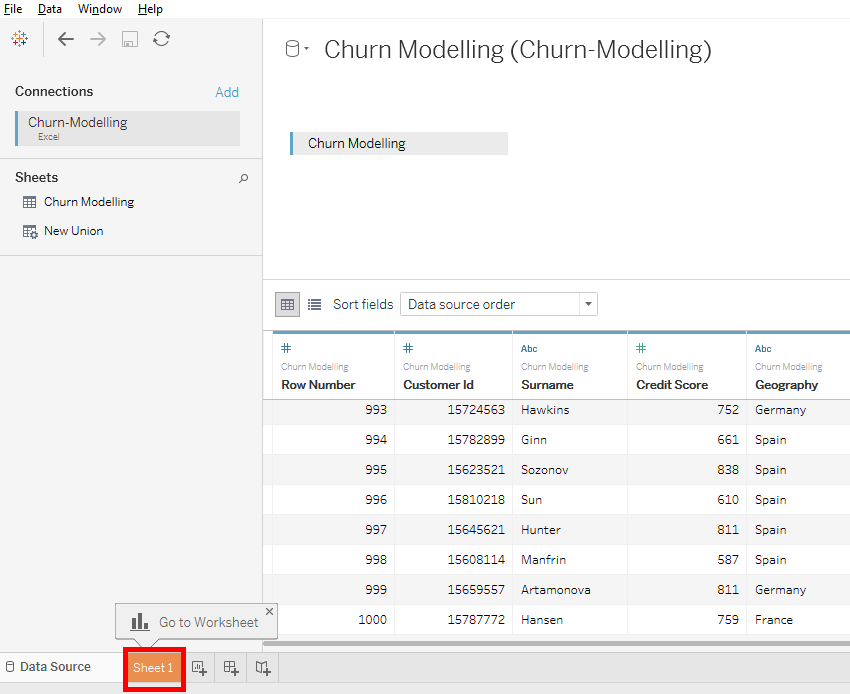
Now, click on the « Sheet1 » tab to access the Worksheet.
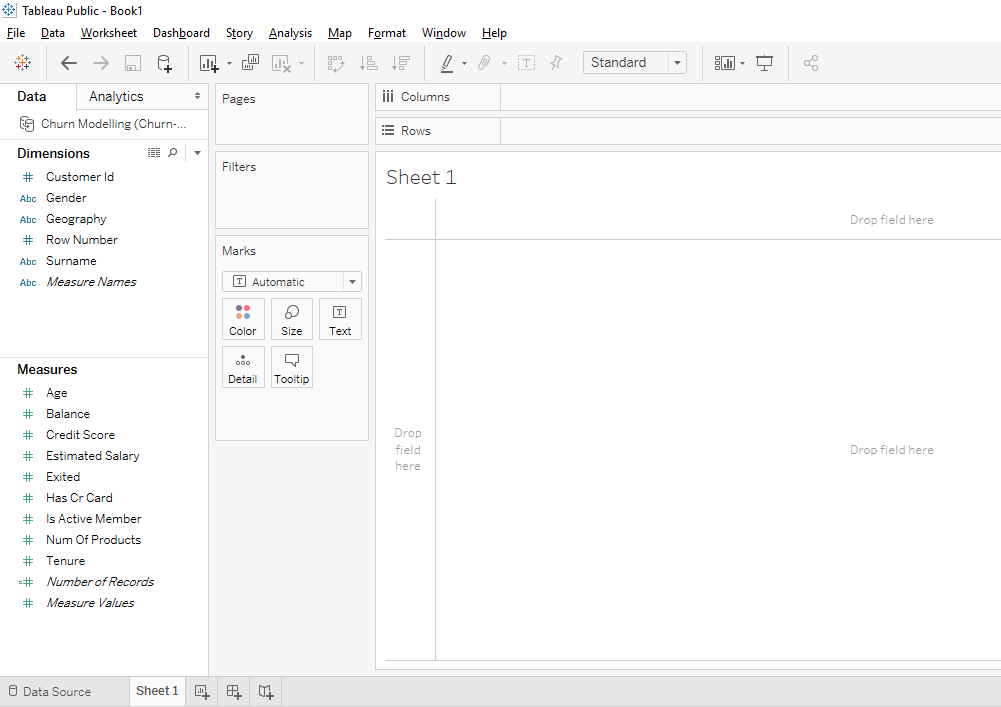
We’ll have a little fun.
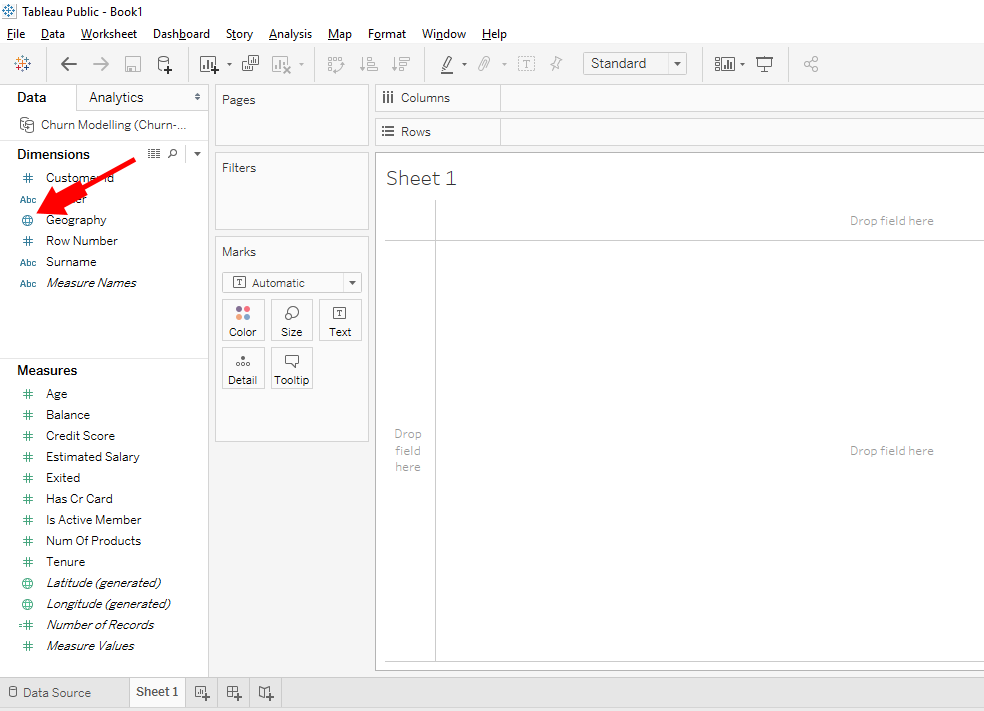
For example, let’s look at what we have with « Geography »
« Geography » is the dimension that gives us the country, so we’ll make a map to see where the clients from the bank come from.
Move « Geography » on this area.
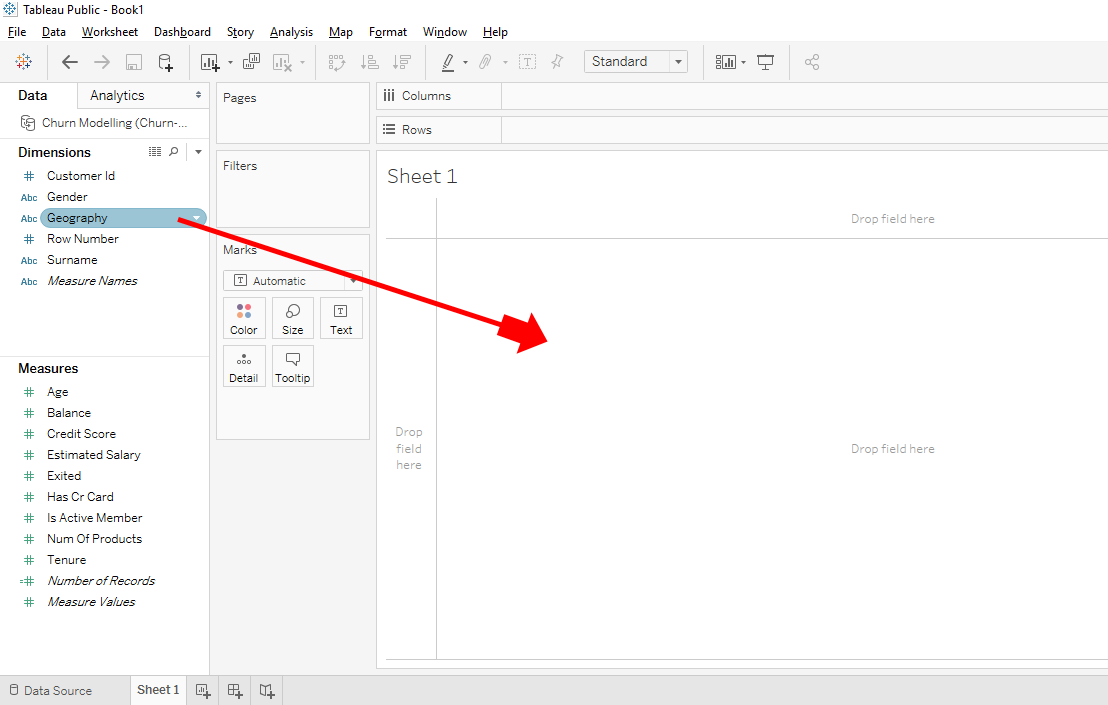

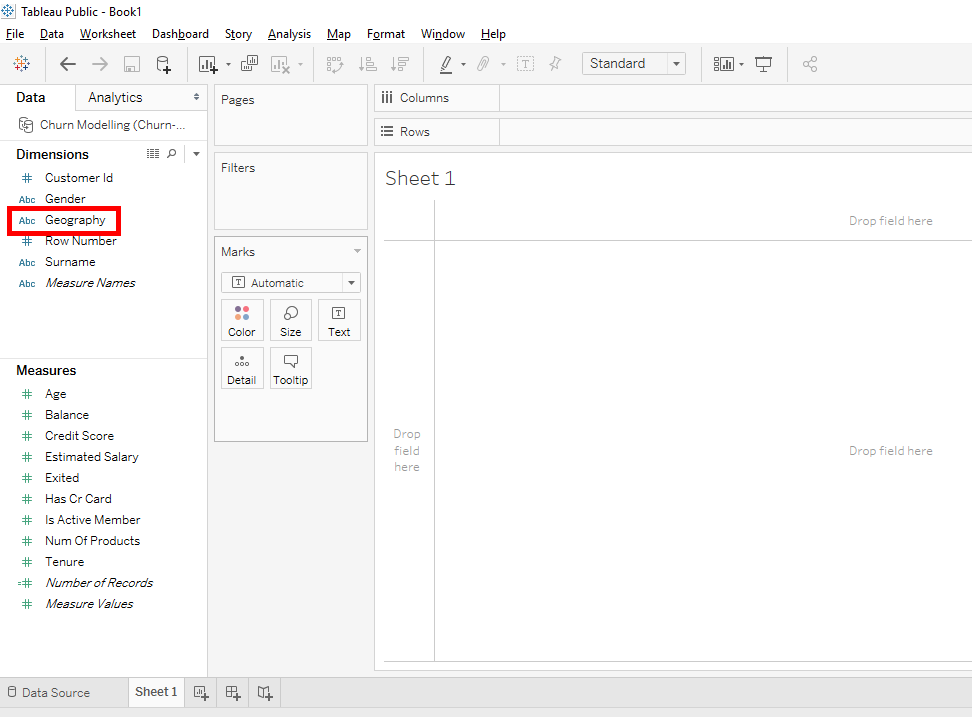
Ah, it’s odd, nothing happens ?!? Why ? Look, when you look at « Geography », it’s not recognized by Tableau as a geographic dimension. Here,, you can see that Tableau recognized « Geography » as a dimension of type text with the label « ABC »
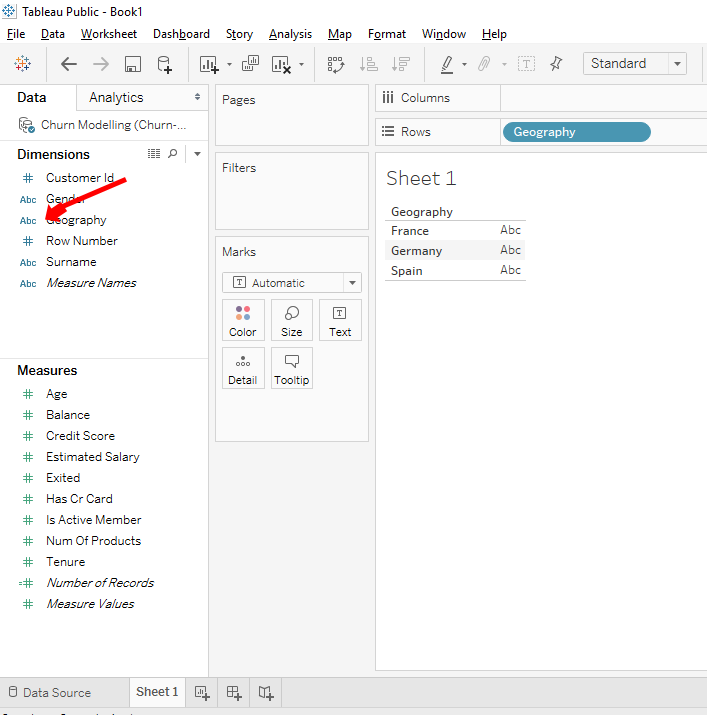
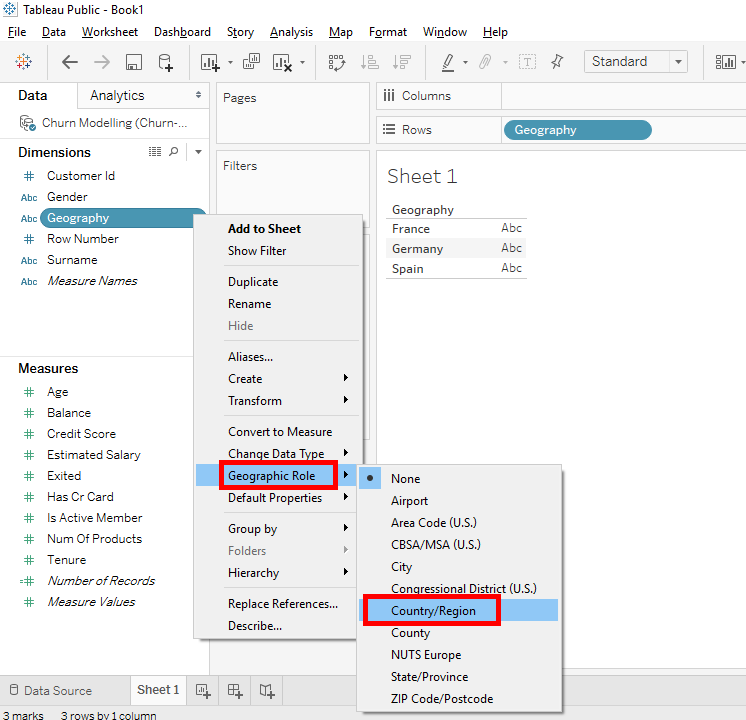
Don’t worry, we can fix it quickly. Click on the arrow of « Geography ».

Selects « Geography Roles » and « Country Region » so that the « Geography » dimension become geography’s type.
Now you remove « Geography » made a table with a click-and-drag.

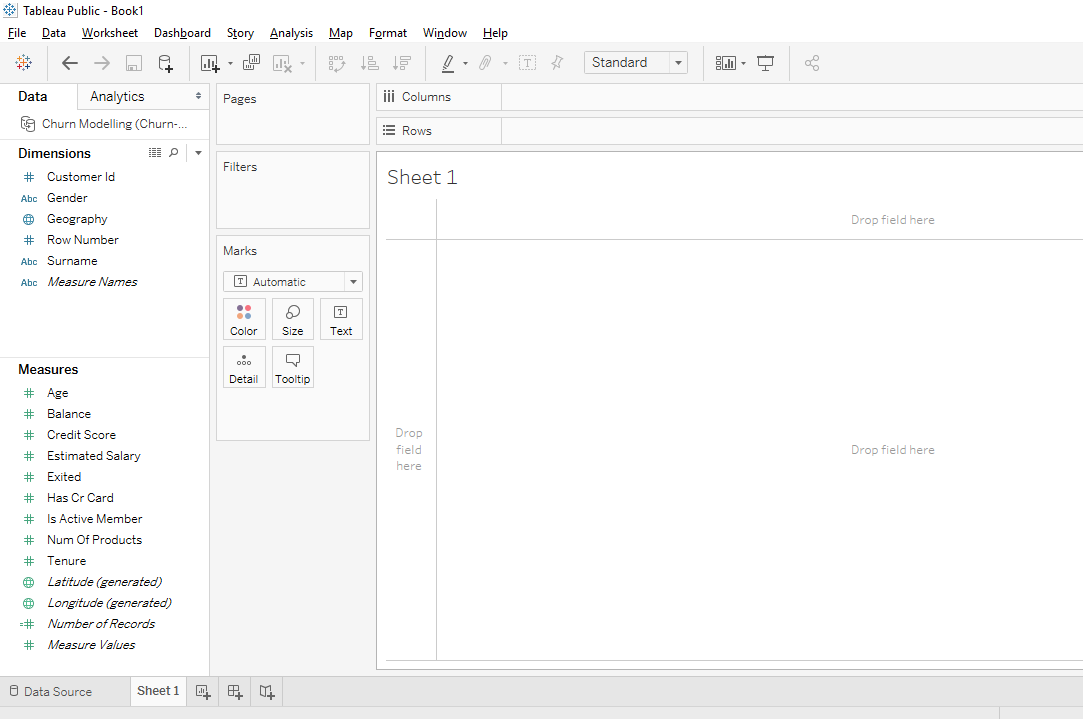
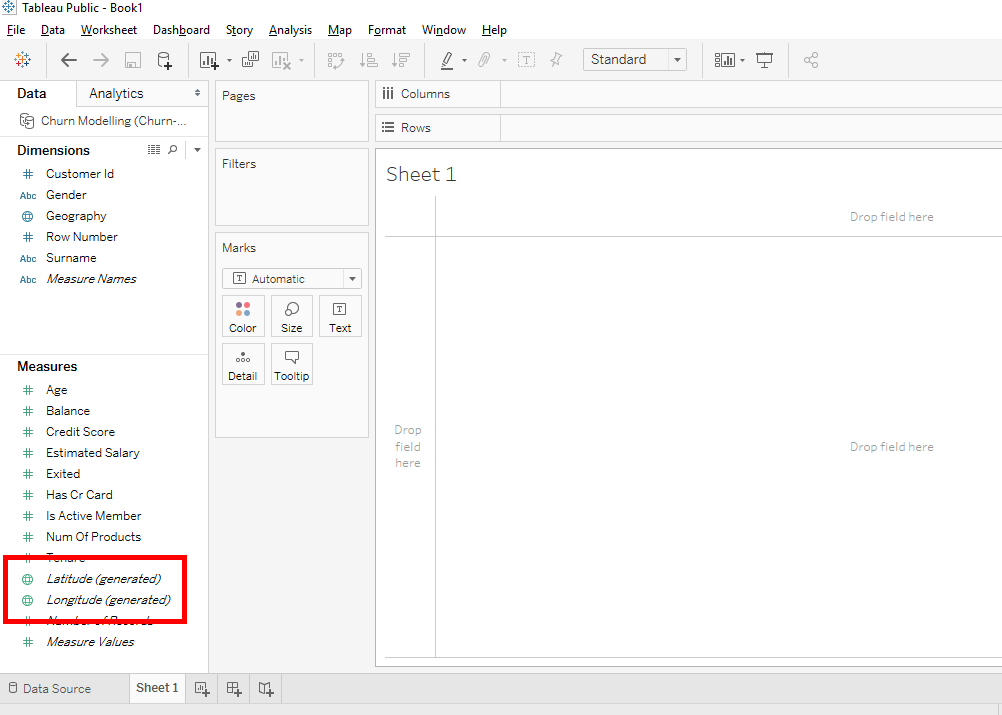
Look, we have a globe next to « Geography ». This means that Tableau recognize that « Geography » is a geographic dimension.
Since « Geography » is a dimension of geography type, there are 2 new measures that have appeared : Latitude (generated) and Longitude (generated).
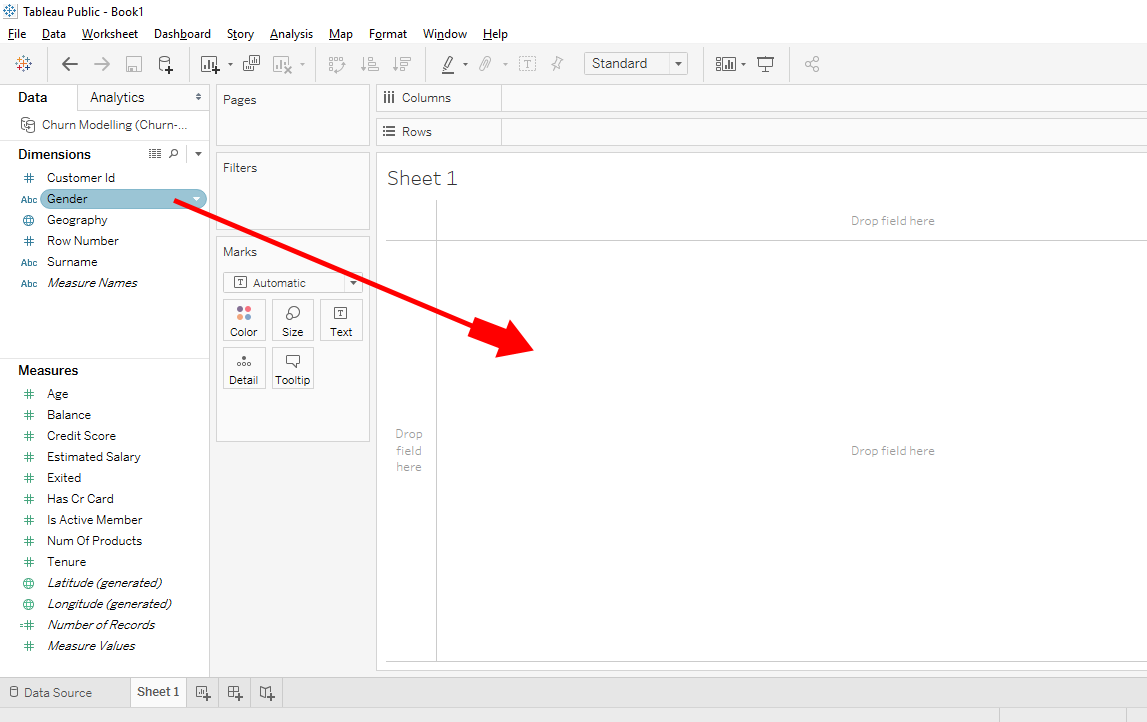
Put « Geography » in this space with a click and drag.
Look, this time there is a map.
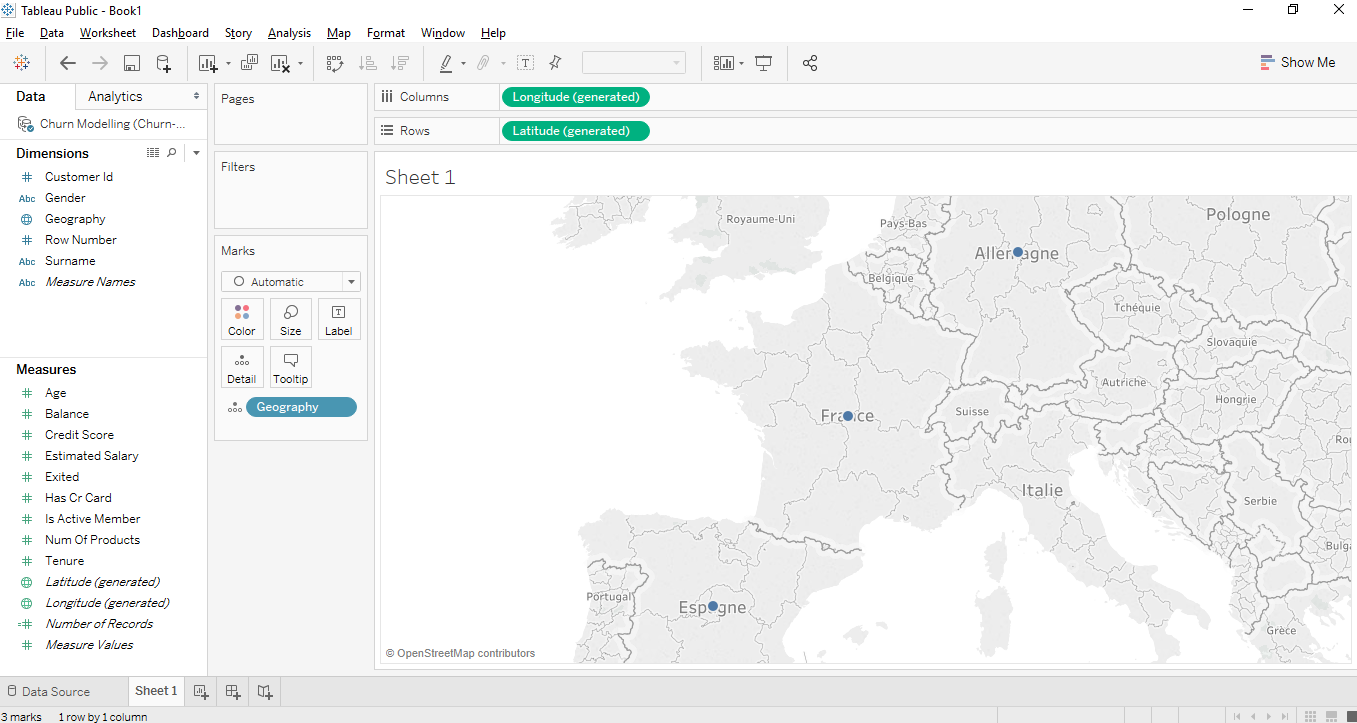
You have the possibility of zooming with these buttons.

The map is fine but we’ll remove the blue dots and modify the map so that it’s easier to read.
We’ll color the countries and display the clients number that has in each country.
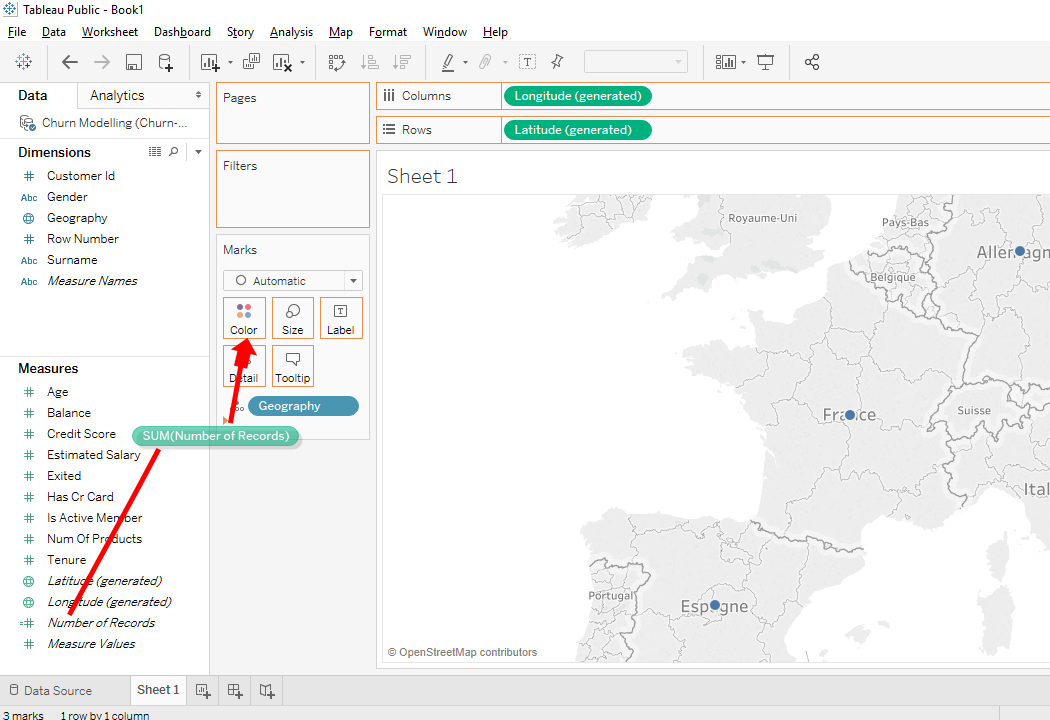
We know that in the dataset each line corresponds to a client. What we can do is use the « number Of Record », it means the total of number of observations. In this way, we can visualize the number of lines attended to each country and the number of lines attended to each country is the number of client per country.
Then, take the « number Of Record » and move it to « Colors ».
Boom ! Each country has a color.
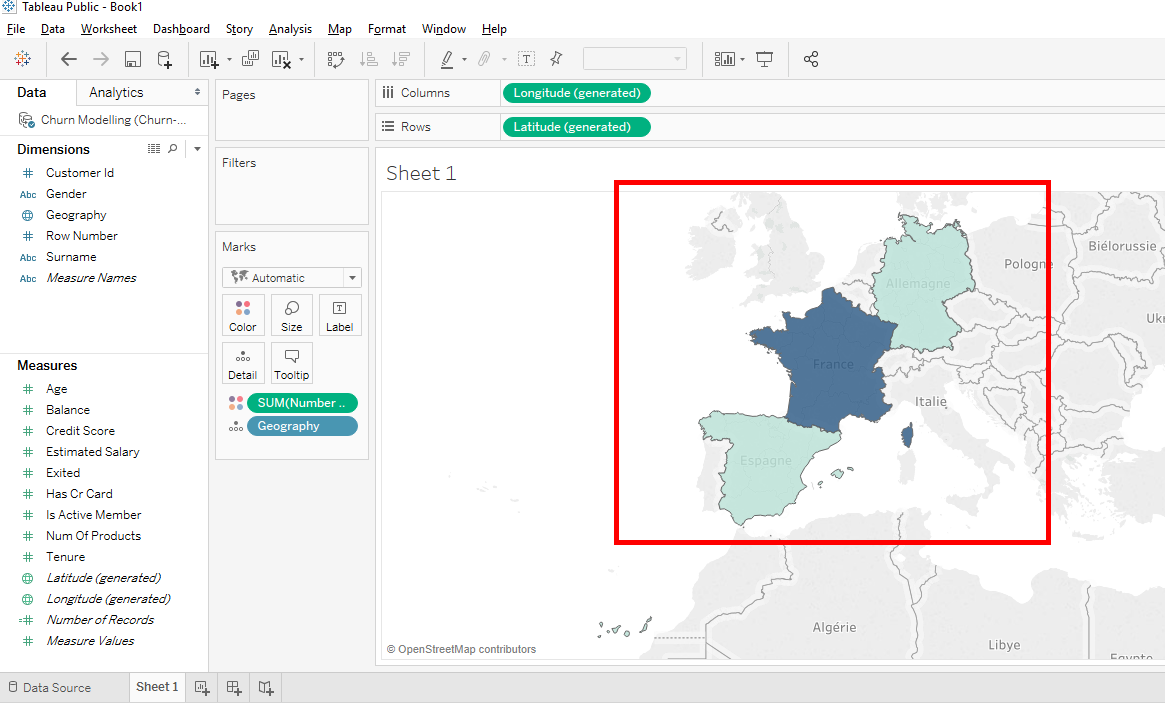
Look at the color contrasts. France has a darker color which indicates that it is the country with the most clients. Germany and Spain have almost the same colors which indicates that they have almost the same clients number.
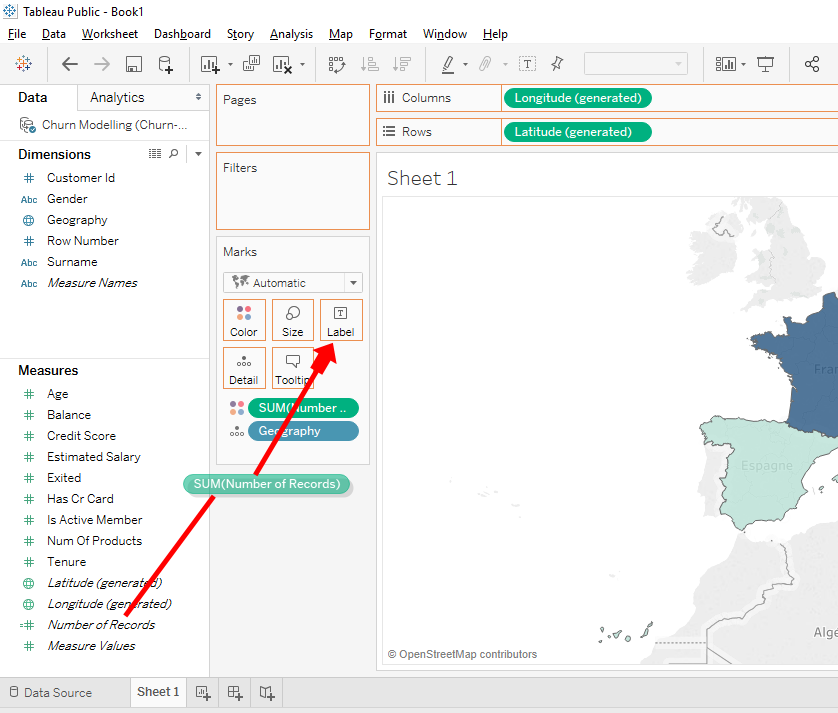
But we want to know the clients number per country without have the cursor on the country.
To do this we’ll add a label. Take « number Of Record » and moves it to « Label ».
We’ll increase the text’s size and put in bold. Click on « Label », click on « Font » and select « 12 » and bold.
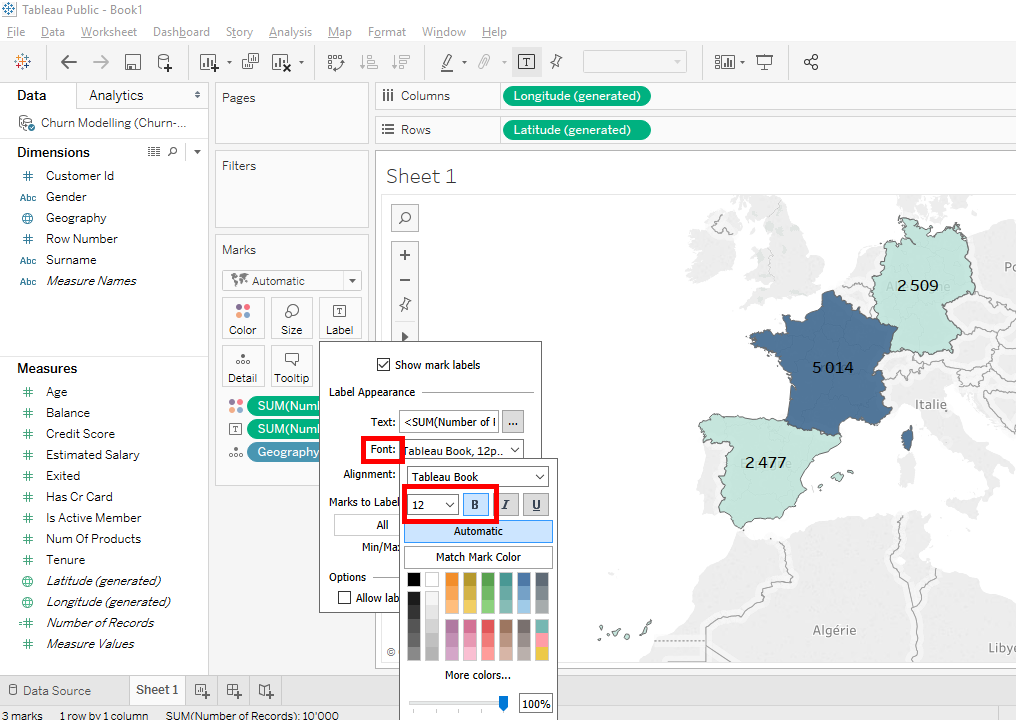
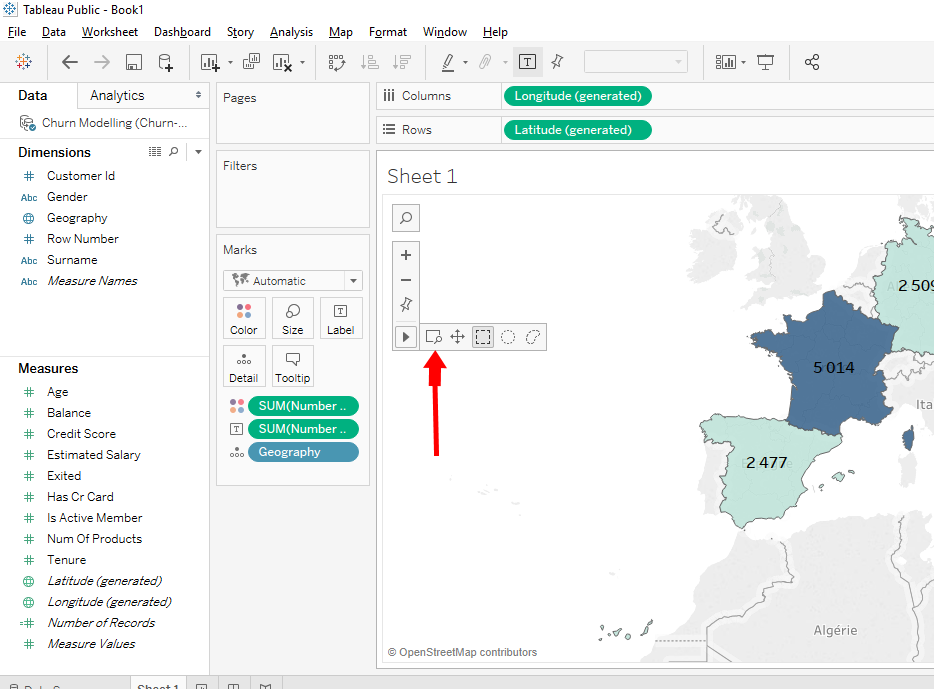
It’s cool, we can see the clients number per country. You have the possibility to zoom on a region. Click on « Zoom area » and drag and drag to select the region on the map.
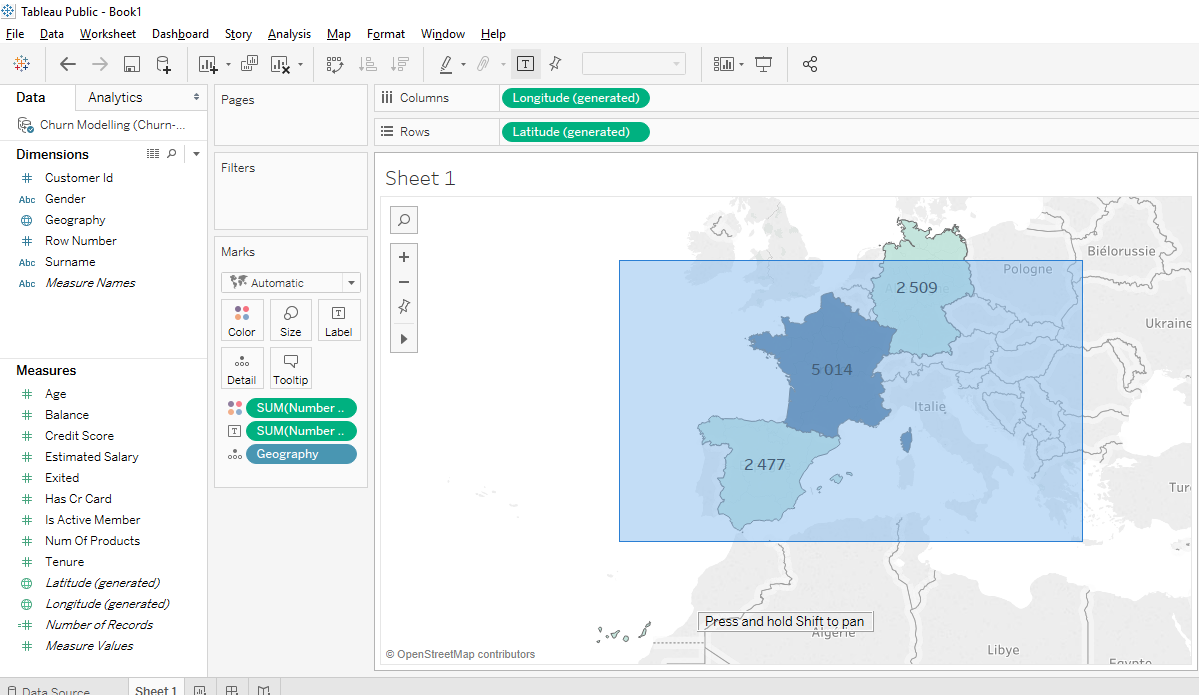
Now we can see that the majority of clients are in France, this represents almost half of the total clients number of the dataset. Germany and Spain have almost the same number of clients.
Share this article if you think it can help someone you know. Thank you.
-Steph