

I have just enrolled in a Data Science course on Udemy and I learned good stuff.
We’ll explore Tableau’s tools
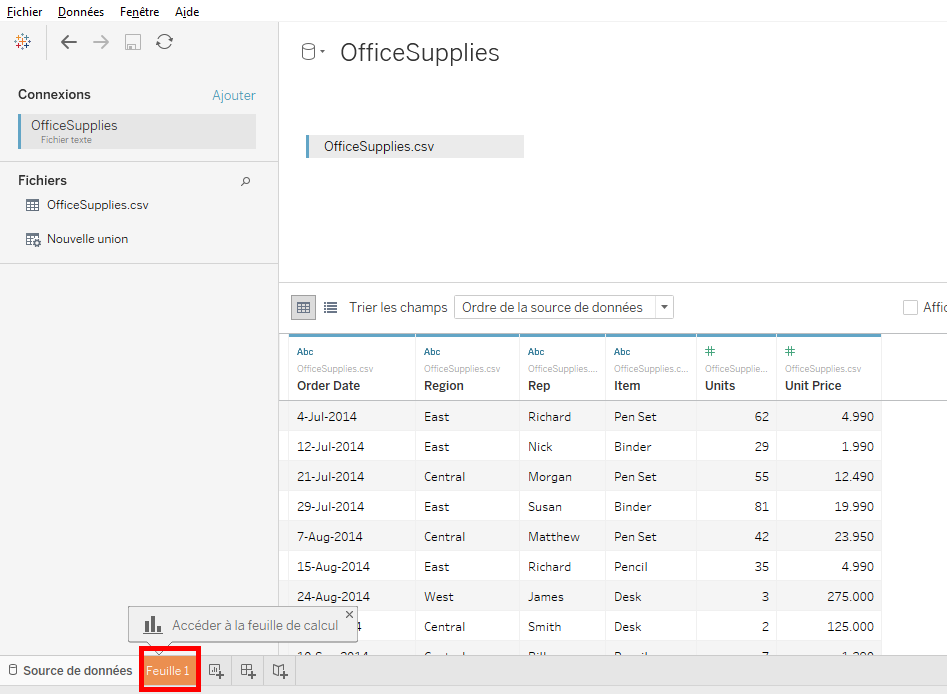
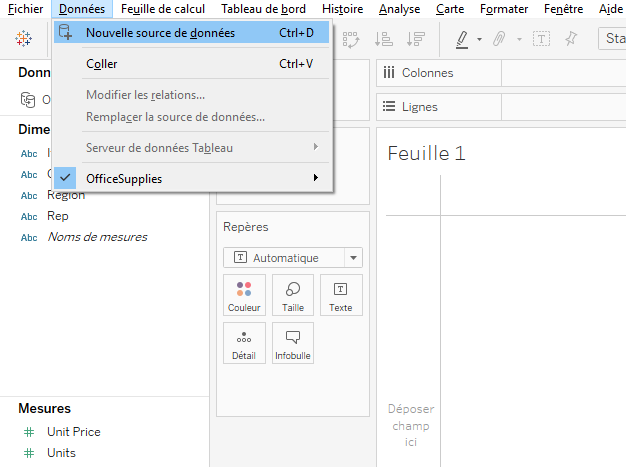
From the connection manager, we’ll go into the Tableau’s workspace.
Click on the « Sheet1 » tab at the bottom of the window.
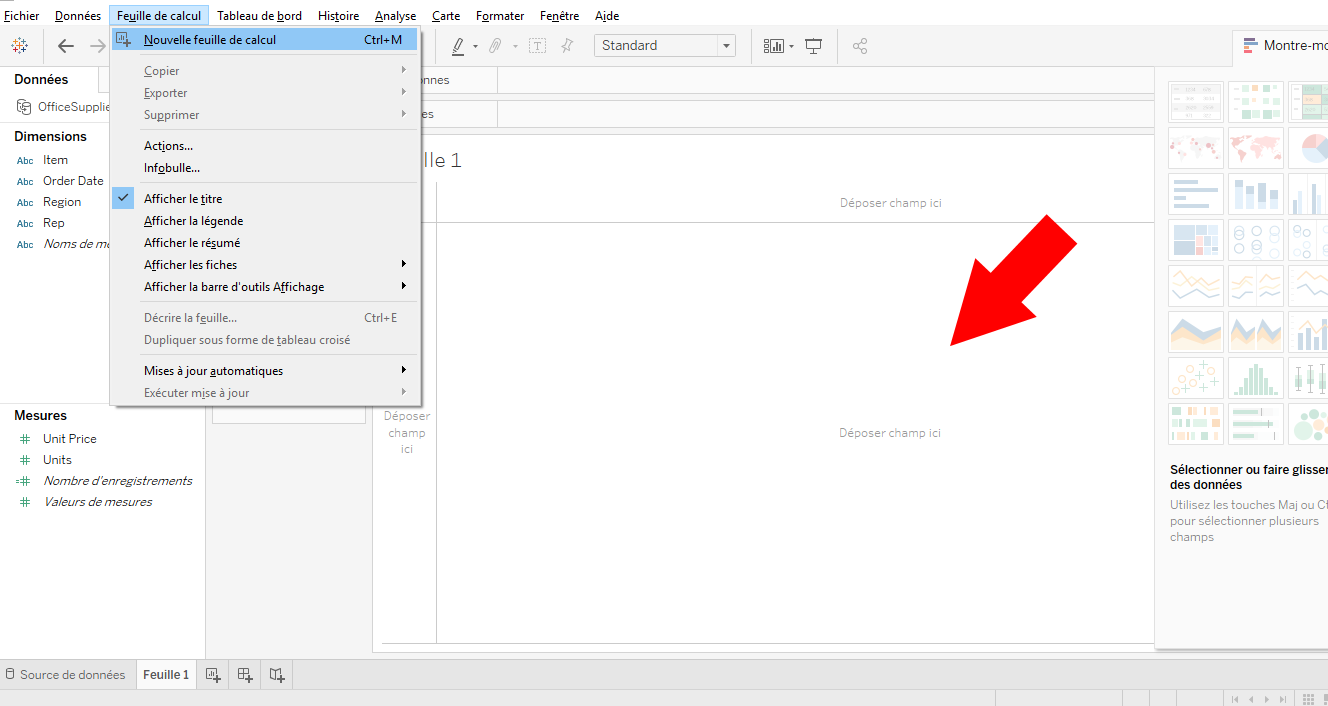
Here is the Tableau’s workspace.
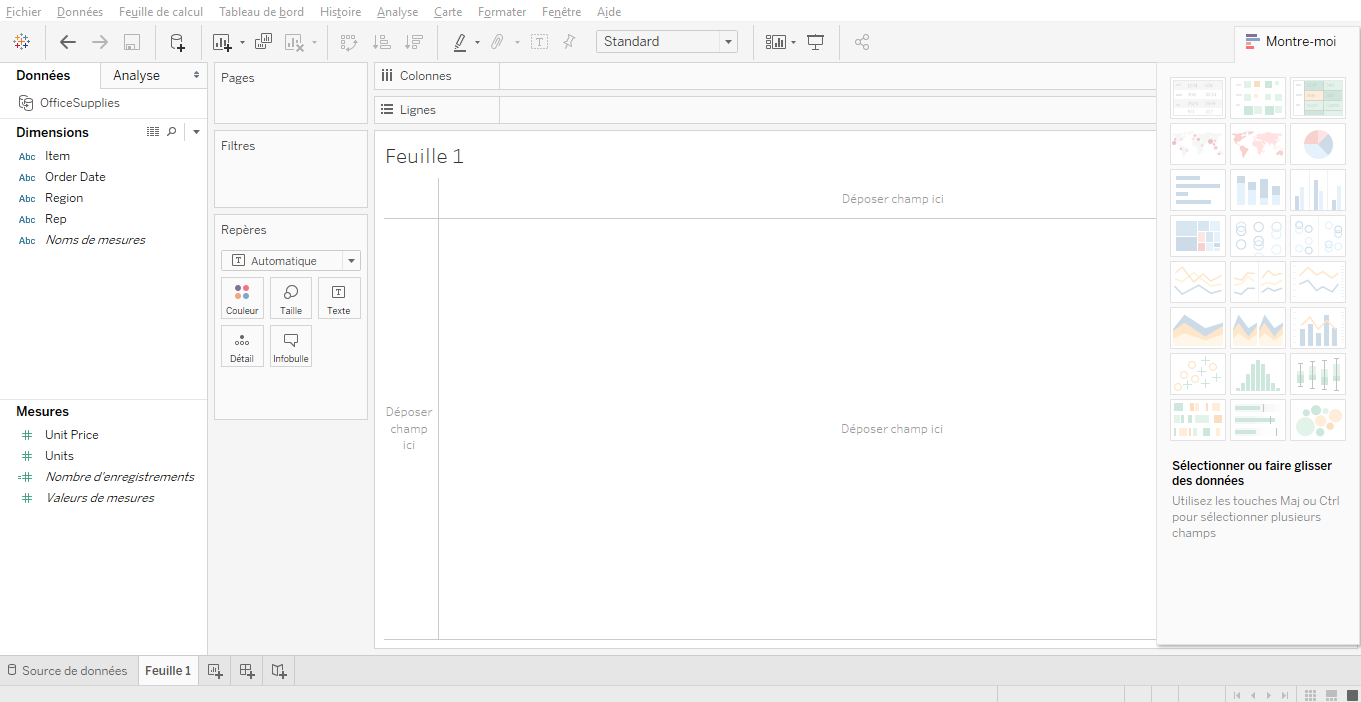
The 2 important elements of the workspace are « Data » on the left and the workspace on the right. It’s in the workspace that you’ll create tables and charts.
We’ll start with « Data » on the left.
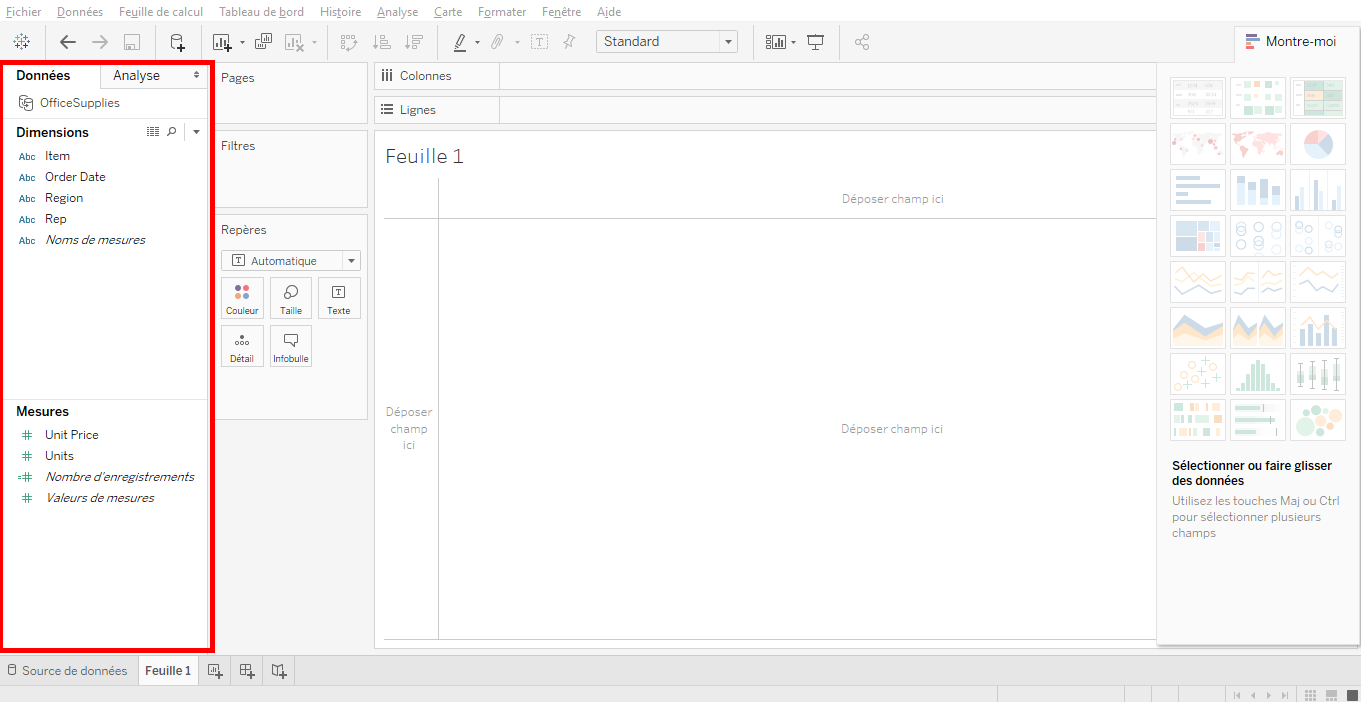
« Data » divided into 2 zones : dimensions and measures.
The dimensions and measures are 2 different rules that will allow you to manipulate data.
Tableau sets the numerical values in « measures » and the categorical or quantitative variables in « dimension ». This is the Tableau’s settings by default.
There is also another way to explain « dimension » and « measures ». The « dimensions » are independent variables and the « measures » are dependent variables.
For exemple, « Units » is a measure, it’s the number of items sold per product. « Region » is a dimension, it’s the geographic region where the product sold. With 2 elements we can know how many items sold by region. This means that « Region » is an independent variable and « Units » is a dependent variable because it will be grouped by region.
But if you don’t like it, you can move the entities between dimension and measures and the opposite by click and drag.
In the menu bar, at the top, there is « File » where you can open and save file.
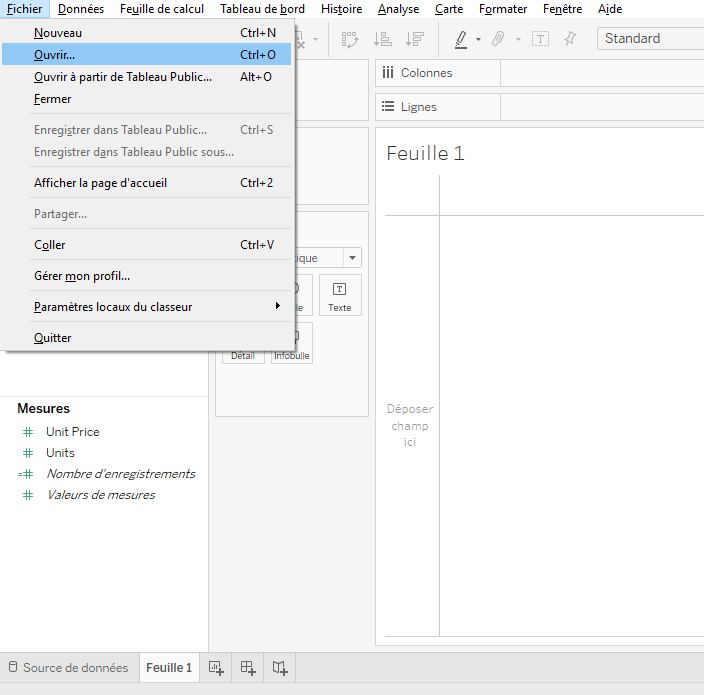
« Data » to connect to new source files.
« Worksheet » is the workspace to create analyzes
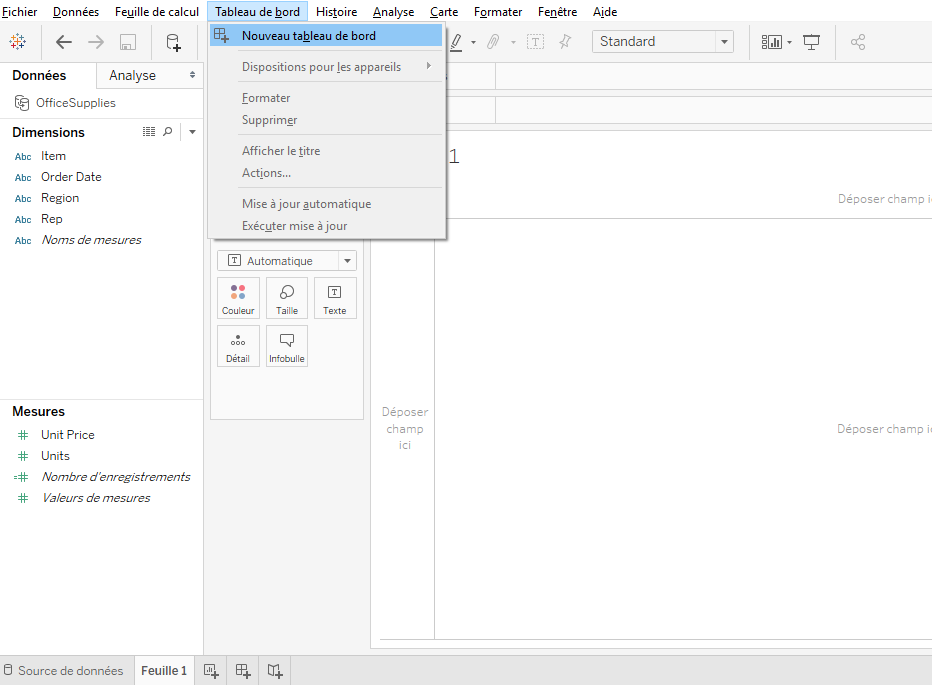
« Dashboard » is a combination of worksheet
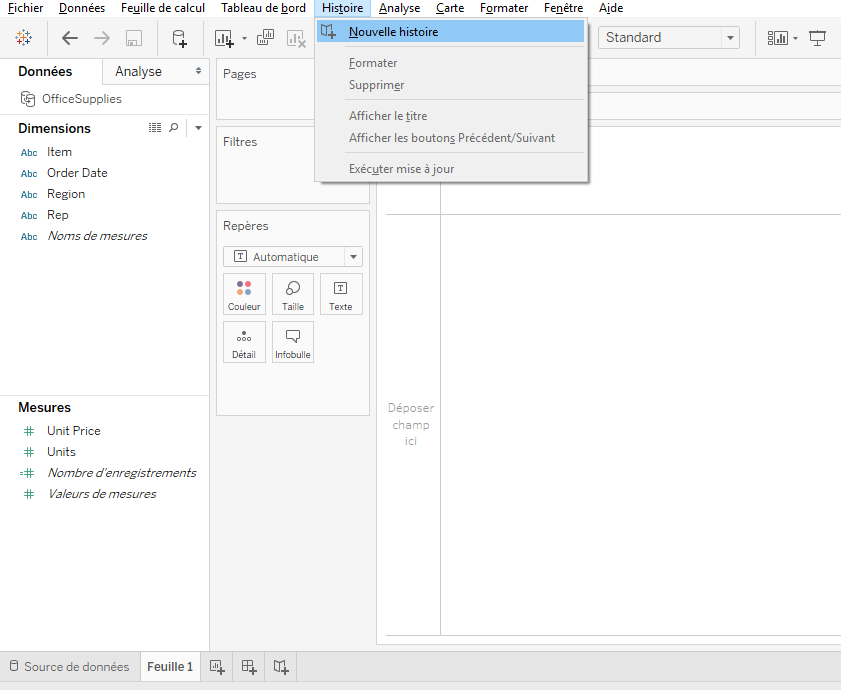
« Story » is a combination of worksheet and dashboard
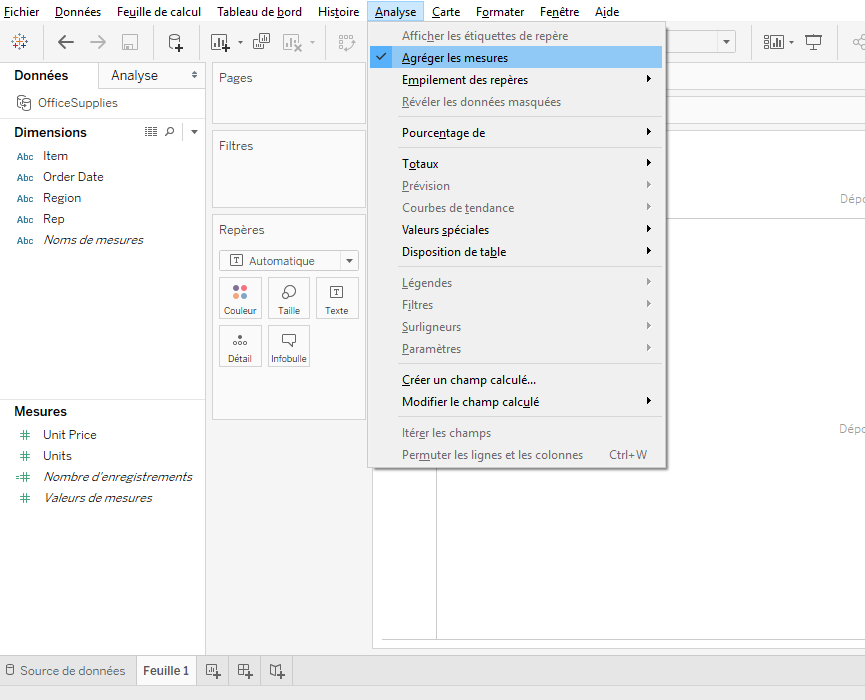
« Analysis » to specify how you want to do your analysis on your workspace
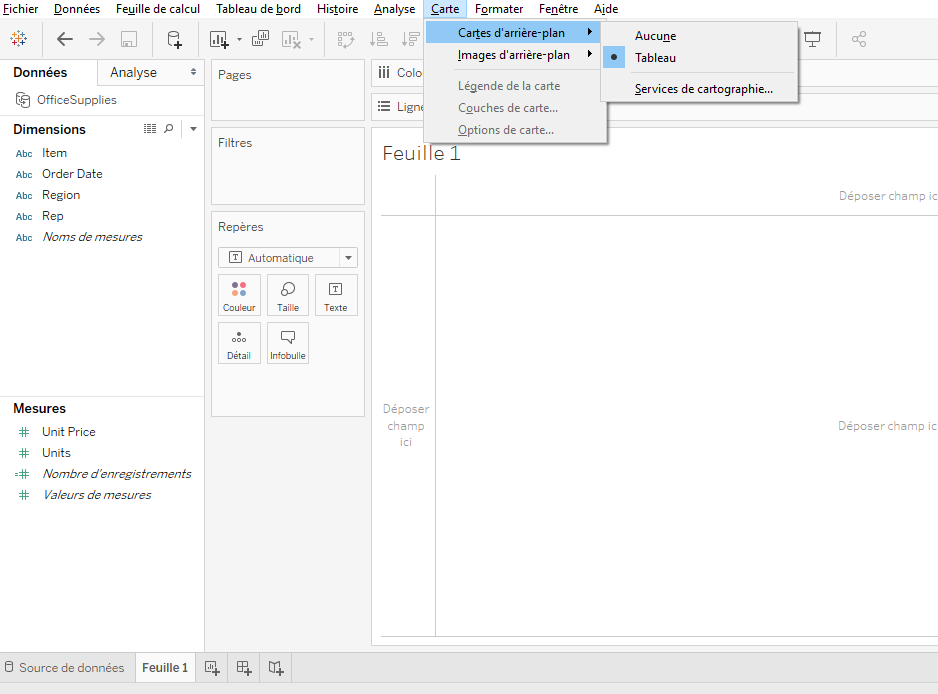
« Map » to add maps to the workspace
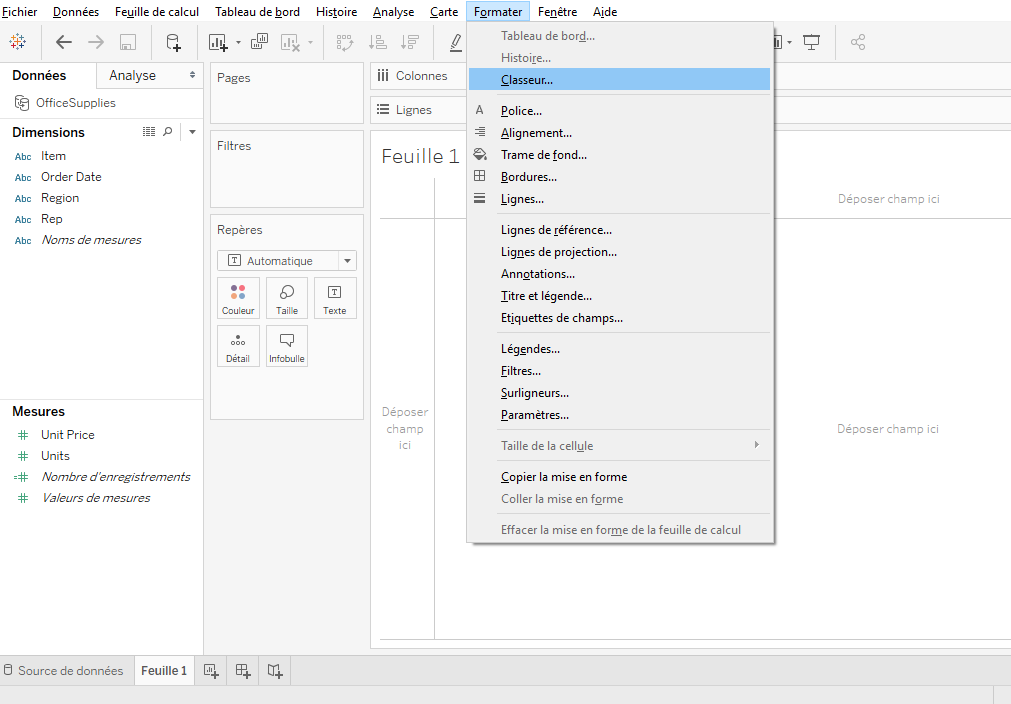
« Format » contains formatting options
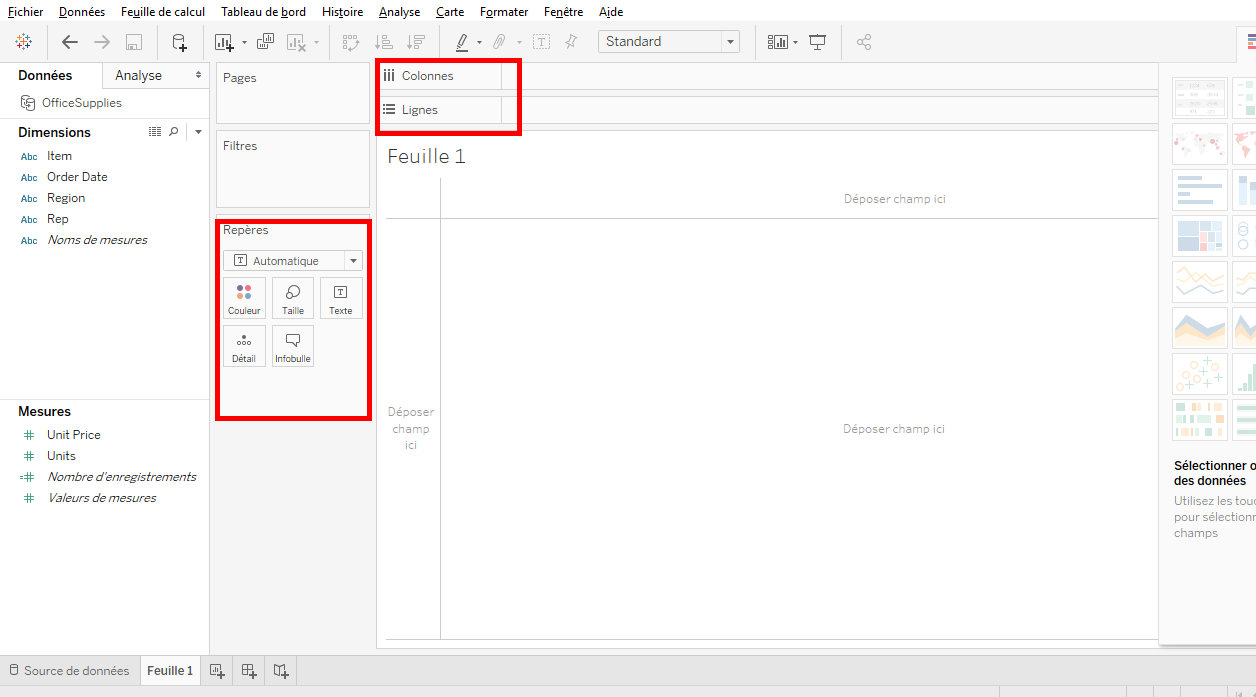
Now, let’s study the workspace.
In the workspace, the main elements are « Columns » and « Rows ». This is where you decide which data goes in columns and rows in your worksheet.
You can also choose different format for these elements like colors, size, text level of detail and tooltips (useful tool optional).
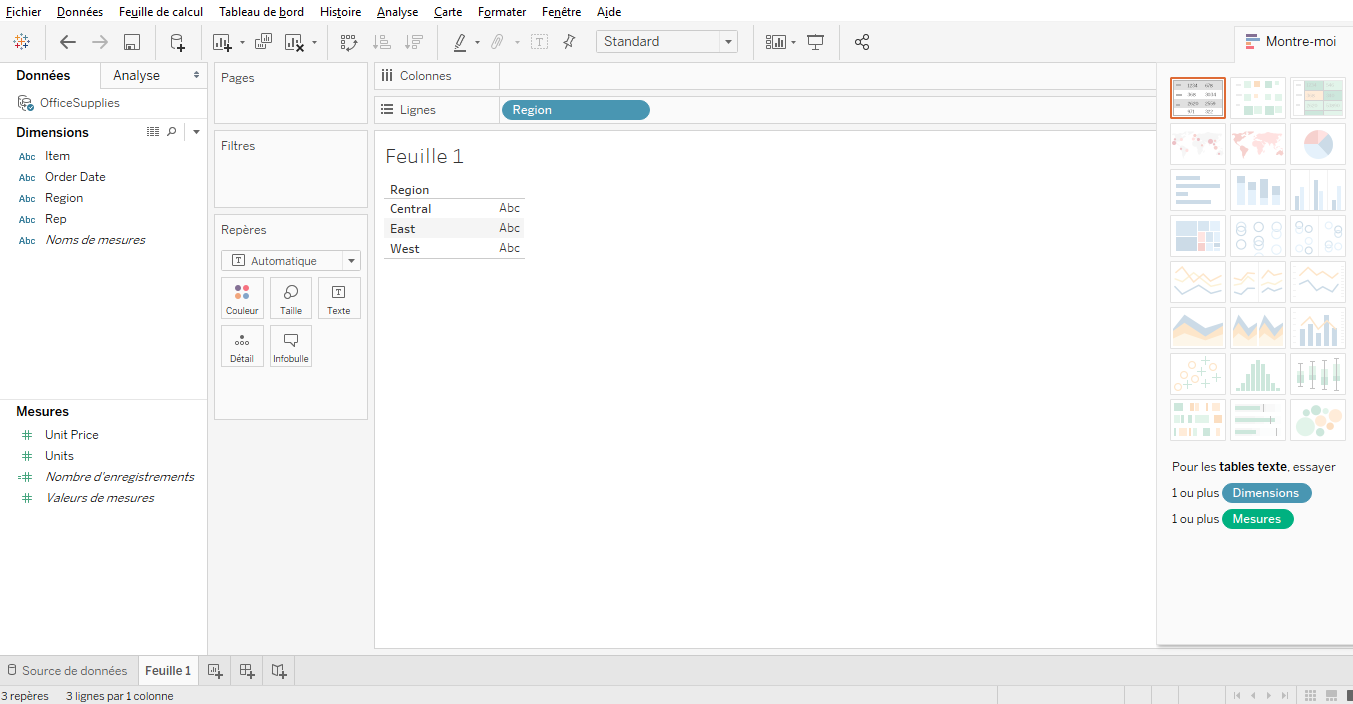
Let’s do a test. Use data from « Region » (which is in « dimension »). Move « Region » with a click and drop to the center of your workspace. Now, « Region » is in the element « Rows ».
A table appears in your workspace.
You put a dimension in your workspace. Now put a measure in your workspace.
Uses the « Units » data. Move « Units » with a click and drop next to the « Region » column.
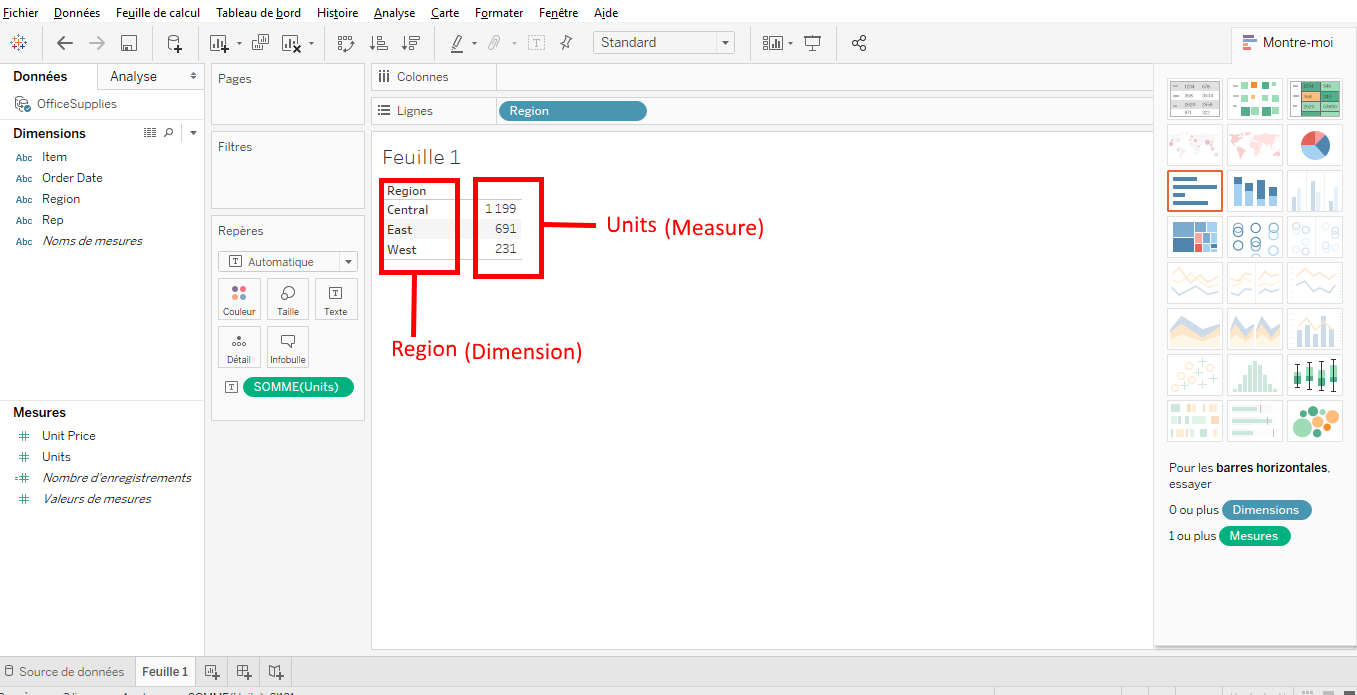
As you can see, Tableau automatically put « Region » in the « Rows » element and the « Units » data aggregated by region. In this way, you can tell how many items were sold by region.
Now, what you can do is to move « SUM(Units) » to the « Columns » element.
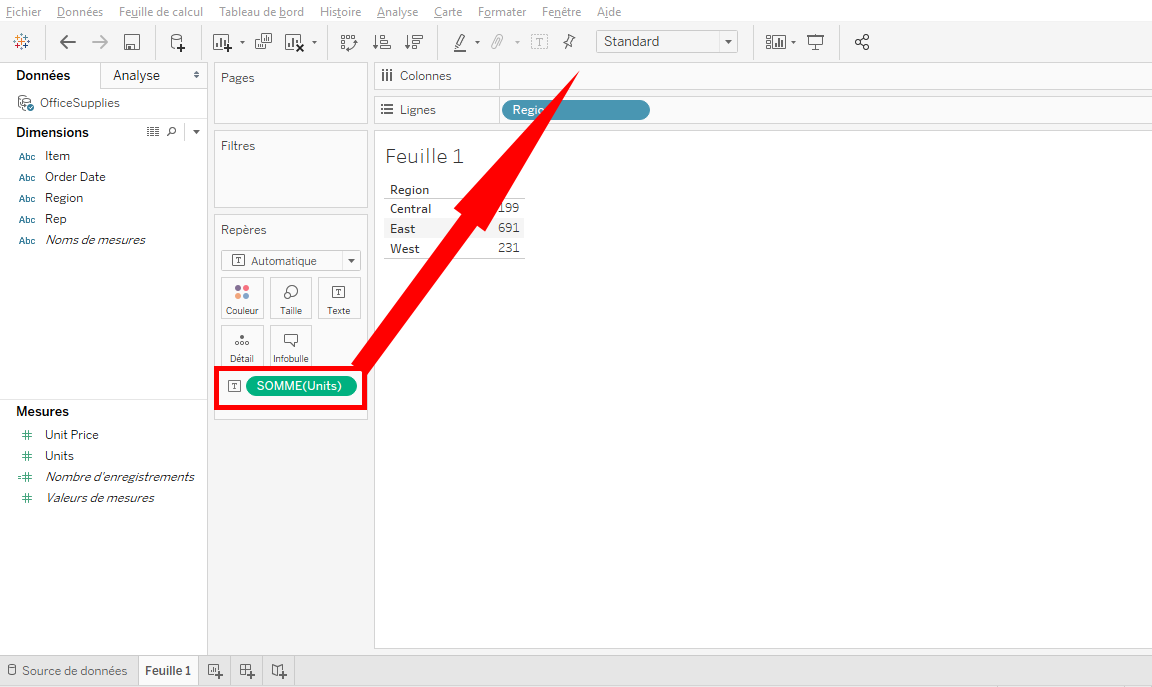

And then, you have a « bar chart » to see how many items have been sold by region. You can enlarge the graphic with a click and drop.
Let’s look at the tools that are in « Show Me » zone.

Click on « Pie chart » to have this chart’s type.
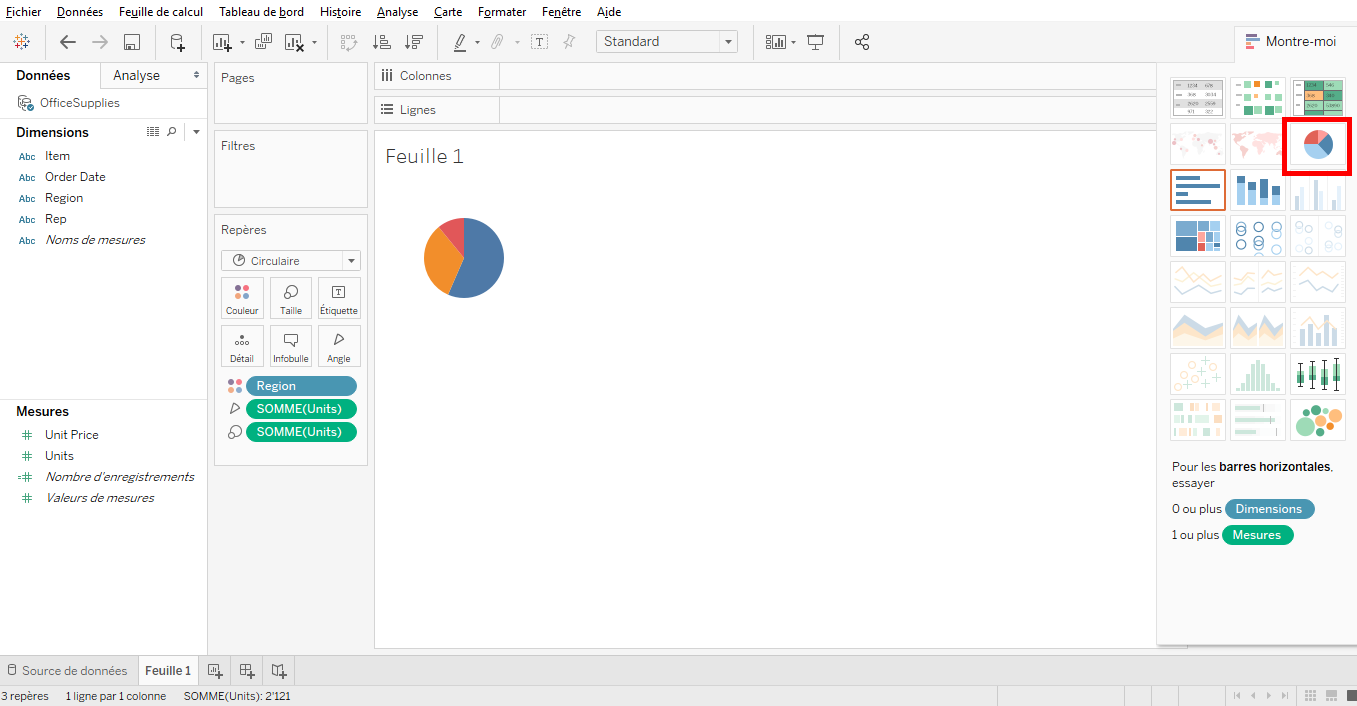
Click on « Size » icon and drag from left to right you can increase the chart’s size.

In this chart, each region has a color and proportion of items sold by region.
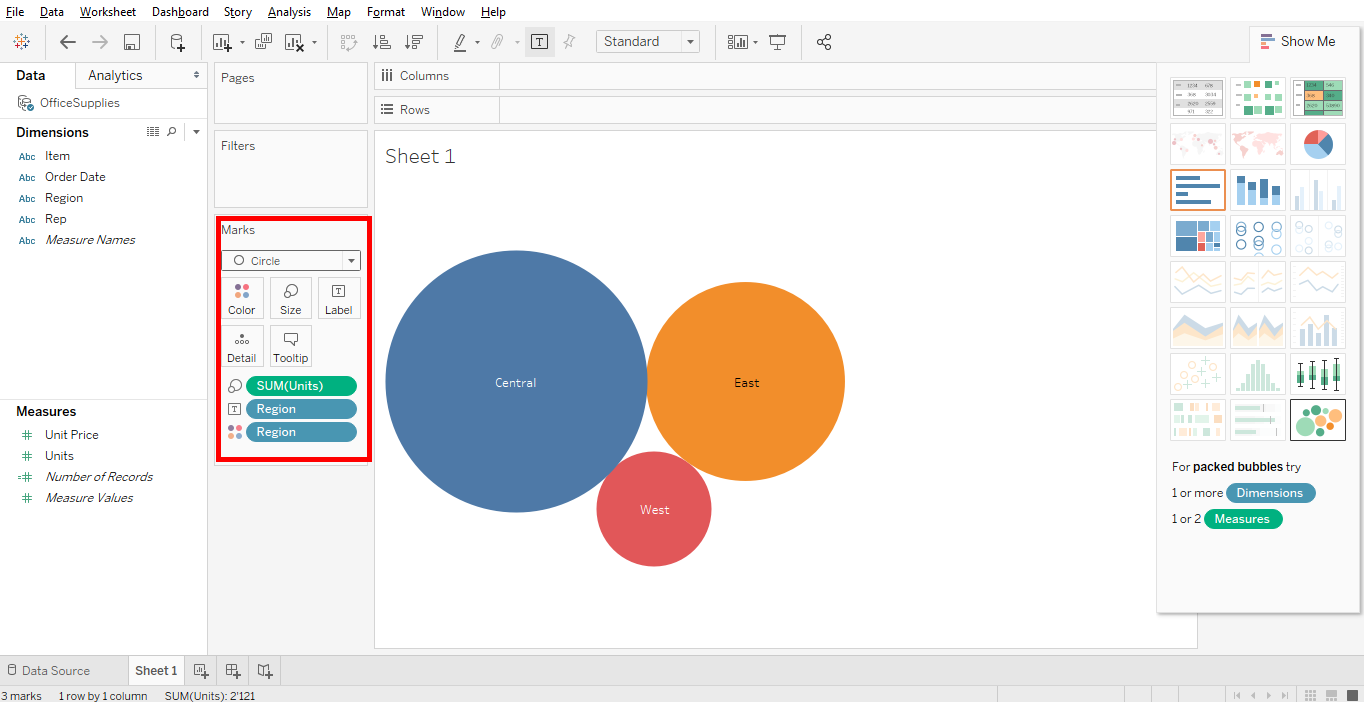
You can also test the « bubble chart ». Tableau organizes the data automatically and everything and placed in the « Marks ».
You can test « Treemaps » chart. This is the same principle as « bubble chart » but it’s rectangles instead of circles.

As you can see in « Show Me », there are charts disabled. This is because you need some elelments in your data to be able to activate them.
For example for the « Area chart », you need « date »data to activate it.
Share this article if you think it can help someone you know. Thank you.
-Steph